
Explore our expert-made templates & start with the right one for you.
Benchmarking AWS Athena vs BigQuery: Performance, Price, Data Freshness
-
 Eran Levy
- Cloud Architecture
- December 6, 2019
The following article is part of our free Amazon Athena resource bundle. Read on for the excerpt, or get the full education pack for FREE right here.
With the cloud wars heating up, Google and AWS tout two directly-competing serverless querying tools: Amazon Athena, an interactive query service that runs over Amazon S3; and Google BigQuery, a high-performance, decoupled database. In this document we will take a closer look at these two services, and compare their real-world performance executing a series of SQL queries against the same dataset.
The Goal: Comparing Costs and Performance
There are plenty of good feature-by-feature comparison of BigQuery and Athena out there (e.g. here, here and here), and we don’t have much to add to that discussion. However, what we felt was lacking was a very clear and comprehensive comparison between what are arguably the two most important factors in a querying service: costs and performance.
Hence, the scope of this document is simple: evaluate how quickly the two services would execute a series of fairly complex SQL queries, and how much these queries would end up adding to your cloud bill.
The Data
We used the popular taxi rides in New York dataset, which has also been used in previous benchmarking tests. This data ‘weighs’ 138 gigabytes and contains 1.1 billion rows. We used the entire dataset of rides from 2009-01-01 to 2015-06-30
We uploaded the dataset into BigQuery; Athena’s serverless architecture meant we ingested the data into Amazon S3, which Athena could then query directly. The process was straightforward enough for both services – however, as we shall proceed to see, data ingestion practices made a big difference.
Data Ingestion, Storage Optimization and Data Freshness
Query performance in Athena is dramatically impacted by implementing data preparation best practices on the data stored in S3. You can find this in Amazon’s documentation, and we’ve also covered this topic extensively in previous articles which we will link below.
We wanted to benchmark this difference, both to show the impact of using Upsolver’s data lake ETL, and because manually implementing these best practices could be fairly complex and impact the time-to-production of your analytics infrastructure.
Simulating Data Freshness
While we ran our tests on a static dataset, in the real world Athena is often used to query streaming data. In these cases, there is often a separate challenge around access to fresh data, which requires continuously orchestrating complex ETL jobs on data being ingested at high-velocity.
In order to address this, we simulated the way data would be ingested using batch or micro-batch processing tools, such as AWS Glue or Apache Spark, by writing files containing a few minutes of data to S3 (based on event processing time). To see how this would affect performance, we compared these versions of the ingested dataset to the data we ingested using Upsolver’s stream processing.
The end result was that we ran our Athena queries on three different versions of the same original dataset:
- Parquet files generated on every 5 minutes of data, to simulate 5-minute batch processing (this is the shortest batch window you can get with AWS Glue today), and without optimizing the data on S3 in terms of file sizes and partitioning
- Parquet files generated on every 1 minute of data, to simulate 1-minute batch processing, also without optimizing storage
- An Upsolver Athena output, which processes data as a stream and automatically creates optimized data on S3: writing 1-minute Parquet files, but later merging these into larger files (learn more about compaction and how we deal with small files); as well as ensuring optimal partitioning, compression and Hive integration.
As you will see below, Athena queries on optimized data ran significantly faster, especially when in the case of 1-minute Parquet files (fresher data).
Additional Methodology Notes and Caveats
Before we dive into the results, two more housekeeping notes:
- Athena and BigQuery both charge $5 per terabyte of data scanned; we derived price from the amount of data each query needed to scan in order to return results.
- Athena and BigQuery both rely on pooled resources, which means they do not guarantee consistent performance. The same query could take 10 seconds to return once, and 7 seconds immediately afterwards. To try and address this we ran each query several times and the data we present is an average sample.
- In both cases, we needed to do some data cleansing and create custom tables to deal with issues such as data type conversions, resulting in minor variations in the SQL used for each platform.
The Results
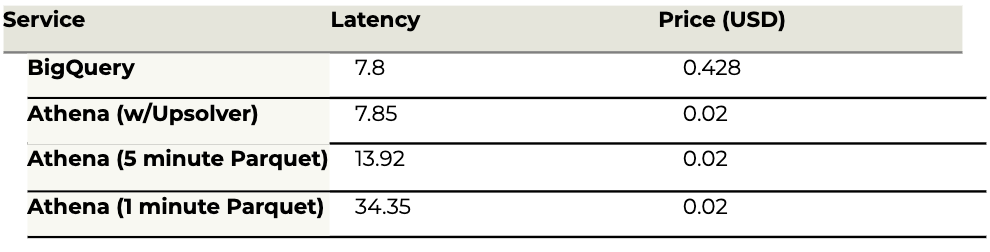
We ran a series of complex SQL queries in both Athena and BigQuery. You can find the details below, but let’s start with the bottom line:
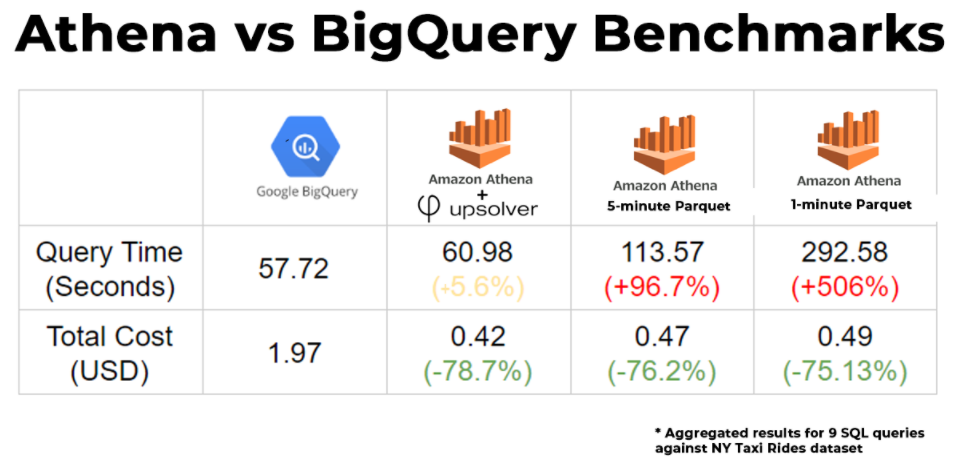
Performance
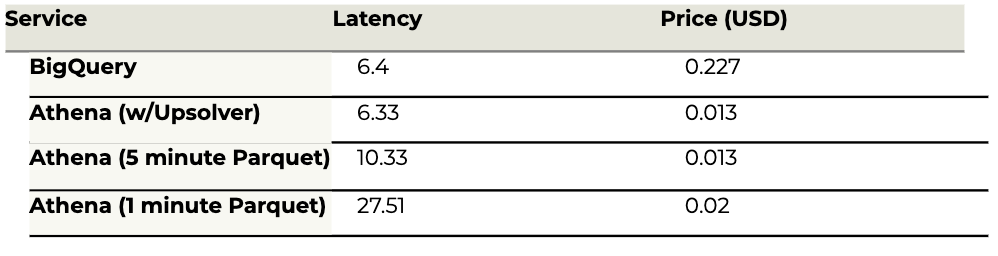
When the data is optimized, Athena and BigQuery performance is similar – queries took about the same time to return on average, with certain queries running faster in Athena, and others performing better in BigQuery. All in all, BigQuery managed to eke out a 5.6% advantage in aggregate query performance.
However, when we didn’t rely on Upsolver’s optimization of the data on S3, the results looked different – in this case BigQuery performed significantly faster in most queries, with queries returning results nearly twice as fast, on aggregate.
These results were even more dramatic on the 1-minute Parquet files, meant to simulate streaming data being processed in near real-time. In this case, the fact that the data was not compacted meant Athena had to scan a much larger amount of files, which caused a significant slow-down in query performance and placed it far behind BigQuery.
Costs
Here Athena wins in a knockout: Athena is significantly less expensive than BigQuery, regardless of whether we optimize the data beforehand. This could be explained by the fact that Athena pricing is based on scanning compressed data, whereas BigQuery looks at the size of the same data decompressed, or by some internal optimization in the way queries are executed, which we are not privy to.
Either way, Athena manages to scan much less data to return the same queries, with the end result being that running the same analytic workfload in Athena would cost %75-79 less than in Bigquery.
Performance by Query
We will proceed to detail each query that we ran and the results we got from each service. You can find a summary of these results in this Google Sheet.
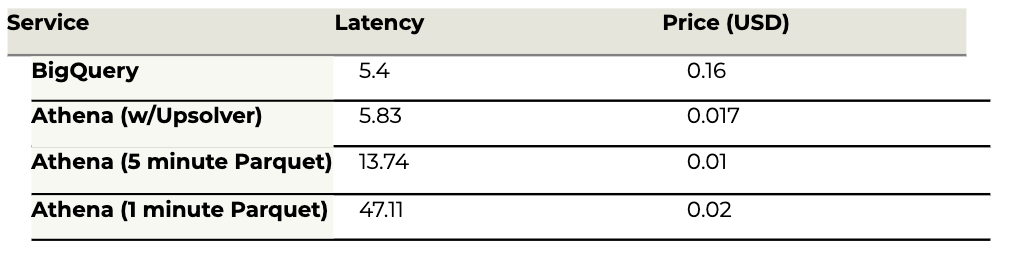
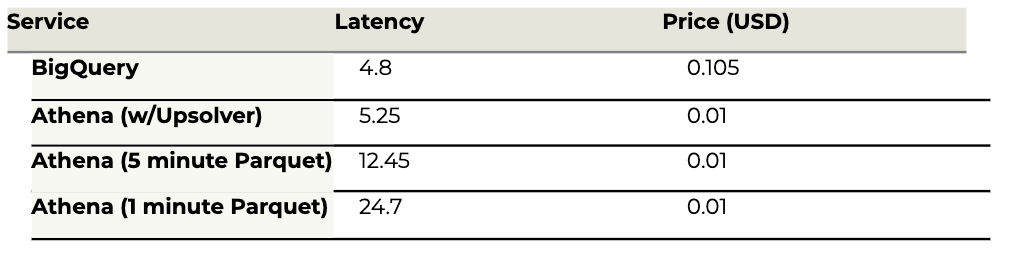
Query #1: Rare tips per date
Calculate the percentage of rides in which an unusually high tip is left by the passenger, per pickup date:
select pickup_date , tip_percent
from
(select pickup_date , tip_percent,
ROW_NUMBER() OVER(PARTITION BY pickup_date ORDER BY count ) rank
from
(select pickup_date ,
tip_amount/total_amount *100 as tip_percent ,
count(*) as count
from [TableName]
where total_amount >10
and fare_amount >7
and fare_amount > tip_amount
and tip_amount > 2
group by 1,2))
where rank = 1
order by 1
Results
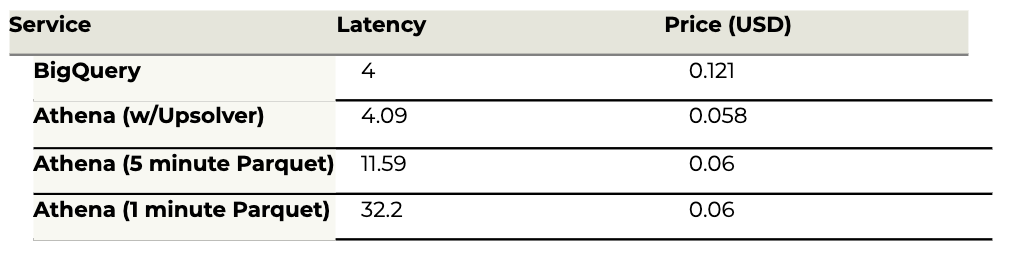
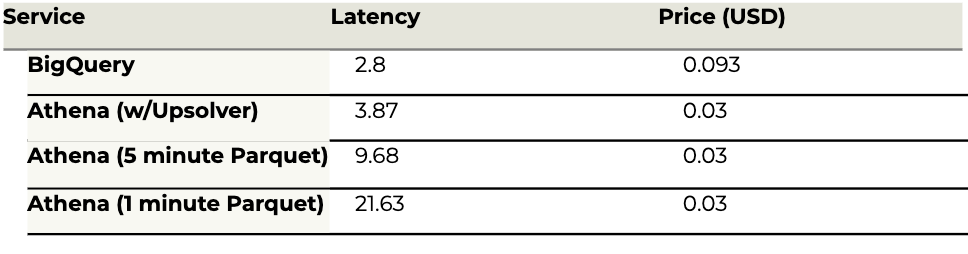
Query #2: Long taxi rides with multiple passengers
Return the longest trips for rides taken by larger groups of passengers:
select pickup_datetime , passenger_count , trip_distance
from [TableName]
where trip_distance > 20
group by 1,2,3
order by passenger_count desc ,trip_distance desc
limit 1
Results
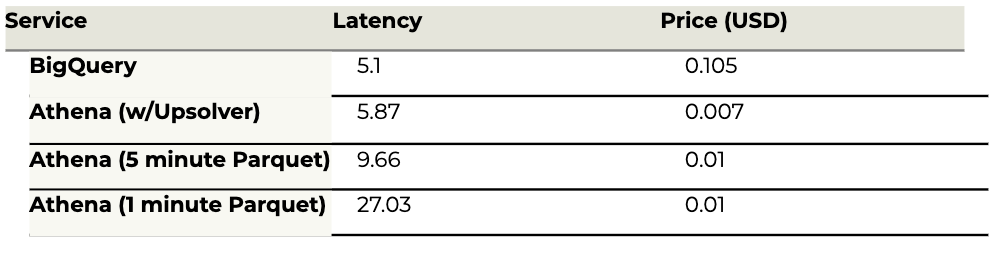
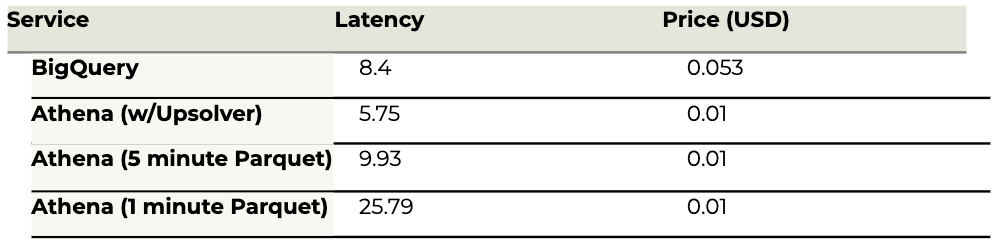
Query #3: Payment types per month
Return the percent of passengers that pay with cash, credit or other, per month of each year:
select pickup_date,
crd_amount/total_amount *100 as crd_percent,
csh_amount/total_amount *100 as csh_percent,
other_type_amount/total_amount *100 as other_type_percent

from
(select pickup_date,
sum(if(payment_type = 'CRD',total_amount,0 )) as crd_amount,
sum(if(payment_type = 'CSH',total_amount,0 )) as csh_amount,
sum(if(payment_type not in ( 'CRD','CSH'),total_amount,0 )) as other_type_amount,
sum(total_amount) as total_amount
from
(select pickup_date , payment_type , sum(total_amount) as total_amount
from [TableName]
where total_amount >3
and total_amount < 1000
group by 1,2
order by 3 desc)
group by 1).

select pickup_datetime , passenger_count , trip_distance
from [TableName]
where trip_distance > 20
group by 1,2,3
order by passenger_count desc ,trip_distance desc
limit 1
Results
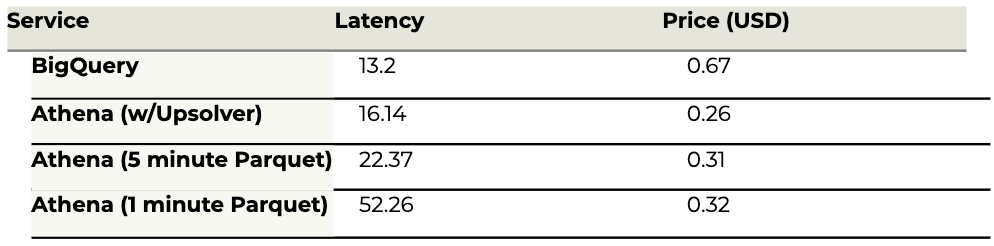
Query #4: Payment types by number of passengers
Return statistics on types of payment per amount of passengers per trip distance:
select payment_type ,
count(*) as count_rows ,
max((passenger_count ) ) as max_passangers,
avg(trip_distance ) as avg_distance
from [TableName]
group by 1
Results
Query #5: Distribution of rides to airport
Return average distance of rides to JFK airport on an hourly basis:
select hour(pickup_timestamp) as hour ,
sum(if( trip_distance < 15 ,1,0)) as num_of_shorts_rides,
sum(if( trip_distance >15 and trip_distance<100 ,1,0)) as num_of_average_rides,
sum(if( trip_distance >100 ,1,0)) as num_of_long_rides
FROM [TableName]
where rate_code = 2
group by 1
order by 1
Results
Query #6: Amount of rides by rate code
Calculate the total number of rides taken for each rate code:
select case
when rate_code = 1 then 'Standard'
when rate_code = 2 then 'JFK'
when rate_code = 3 then 'Newark'
when rate_code = 4 then 'Nassau'
when rate_code = 5 then 'Negotiated'
when rate_code = 6 then 'Group'
else 'XXX'
end as rate_code ,
count(*) as count,
sum(if (trip_distance > 0.5 and trip_distance < 1000,1,0 )) as real_count
from [TableName]
group by 1
order by 2 desc
Results
Query #7: Types of rides to JFK by hour
select hour(pickup_timestamp) as hour ,
sum(if( trip_distance < 15 ,1,0)) as num_of_shorts_rides,
sum(if( trip_distance >15 and trip_distance<100 ,1,0)) as num_of_average_rides,
sum(if( trip_distance >100 ,1,0)) as num_of_long_rides
FROM [TableName]
where rate_code = 2
group by 1
order by 1
Results
Query #8: Aggregated data
Return aggregated taxi data including: trip distance, fare, tip, toll charges and amount of passengers:
select *
FROM [TableName]
order by pickup_datetime desc
limit 1500
Results
Query #9: Payment calculation
Ride payment calculation per pickup date and payment type:
select pickup_date ,
payment_type,
case
when payment_type = 'CSH' then sum(passenger_count )/sum(trip_distance )
when payment_type = 'CRD' then sum(passenger_count )*sum(tip_amount )
else sum(passenger_count )+sum(trip_distance )+ sum(tolls_amount )
end as payment_formula
FROM [TableName]
group by 1,2
order by payment_formula desc
Results
Want to master data engineering for Amazon Athena? Get the free resource bundle:
Learn everything you need to build performant cloud architecture on Amazon S3 with our ultimate Amazon Athena pack, including:
– Ebook: Partitioning data on S3 to improve Athena performance
– Recorded Webinar: Improving Athena + Looker Performance by 380%
– Recorded Webinar: 6 Must-know ETL tips for Amazon Athena
– Athena compared to Google BigQuery + performance benchmarks
And much more. Get the full bundle for FREE right here.
Next Steps
- See the impact of Upsolver on your data freshness and query latency by trying SQLake for free (early access). SQLake is Upsolver’s newest offering. It lets you build and run reliable data pipelines on streaming and batch data via an all-SQL experience. Try it for free. No credit card required.
- Dive into our Amazon Athena resource page for further insights and best practices.
- Learn more about ETL for Amazon Athena.
- Follow our step-by-step guide on how to ingest and ETL Kinesis data to Athena in minutes.
Published in:
Blog
,
Cloud Architecture