
Explore our expert-made templates & start with the right one for you.
How (and Why) to Analyze CloudWatch Logs In AWS Athena
-
 Shawn Gordon
- Use Cases
- February 27, 2020
Last updated: January 2021
Amazon CloudWatch is a monitoring service for AWS cloud resources and the applications you run on AWS. While CloudWatch enables you to view logs and understand some basic metrics, it’s often necessary to perform additional operations on the data such as aggregations, cleansing and SQL querying, which are not supported by CloudWatch out of the box.
In this article we’ll present a reference architecture and key principles for storing your logs in analytics-ready format on Amazon S3, and then using Amazon Athena to query and analyze the data.
Example Business Scenario
A company’s IT department is using CloudWatch to monitor infrastructure and troubleshoot issues. After some data has accumulated, an IT analyst wants to explore the data using SQL in order to uncover deeper insights and trends that have emerged over time.
Why Amazon Athena for CloudWatch Logs?
Amazon Web Services offers several tools and databases that could be relevant for the use case we described: Redshift, ElasticSearch, CloudWatch itself and others. However, Athena offers several advantages:
- SQL access: Athena allows our analyst to query the data using the ANSI SQL she already knows and uses in a variety of other contexts
- Joins and enrichments: Exporting the logs from CloudWatch enables us to perform various transformations on the data.
- Cost reduction: Athena’s serverless architecture means we can leverage inexpensive storage on S3 rather than costly database storage
Ruling Out the Alternatives
If those are the advantages of Athena, what are the drawbacks of the other ‘immediate suspects’ we might choose for log analysis?
- Elasticsearch does not provide SQL access, and most data analysts would find it difficult to work with it due to the need to become familiar with its unique syntax. Additionally, it can become costly and hard to manage for large volumes of data which limits log retention period (learn more about Elasticsearch costs).
- Redshift provides SQL access but like any data warehouse, it can become costly and challenging to manage at scale. Additionally, significant ETL effort will need to be made upon ingest to impose a relational model on semi-structured log data.
- CloudWatch keeps us ‘close’ to the source data, but also does not support SQL access, and will not enable us to perform joins or enrichments.
The Challenge
We have CloudWatch logs in the following JSON structure:
{
“time”: 2019-12-29T15:30:02.823Z,
“request-id”: 1a2b3c4d5fhj-124asc,
“duration”: 55.17,
“billed-duration”: 100,
“memory-size”: 512,
“Cluster-id”: 1234,
“Origin”: a.com
“User-agent” : Mozilla/5.0 (Windows NT 10.0; Win64; x64) AppleWebKit/537.36 (KHTML, like Gecko) Chrome/80.0.3987.87 Safari/537.36
}
We want to run a SQL query in Athena to retrieve the total billed duration – a summary of the “billed-duration” field and max memory used per hour (based on the memory-size field).
Before we do that, there are a few obstacles we’ll need to pass:
S3 storage optimization, data cleansing and ETL for Athena
Our first problem is that CloudWatch provides the option to export the logs to S3, but not to Athena. While Athena can read directly from S3, it needs to be aware of the schema of the queried data, which S3 doesn’t provide since it’s sole purpose is to store objects.
Also, CloudWatch’s export will just ‘dump’ the files to S3 without following data ingestion best practices. Querying these files in Athena could significantly increase your cloud bill. Each file has to be optimized by size, compressed, and converted into an easily-queryable format (in the case of log files – a columnar format such as Apache Parquet would be ideal). We’ve covered this topic in much depth before, for example in this webinar about Athena ETL.
Finally, Athena is priced by data scanned. Not all log data is relevant for every query so using JSON files instead of columnar formats, like Apache Parquet,will needlessly increase the amount of data scanned, and as a result – our overall costs.
The solution
We want to build a robust pipeline that can continuously deliver up-to-date data from CloudWatch to Athena, while optimizing the data for consumption to ensure data freshness and performance. Our data engineers are busy with other important projects, so we want this pipeline to be automated rather than require constant manual tuning.
We also want to enable the IT analyst to explore the data in a variety of ways, again without creating a dependency on data engineers or DevOps for every alteration to ETL flows. For this reason we’ll build our solution entirely around SQL rather than more opaque languages and frameworks such as Scala and Apache Spark.
To achieve these goals, we’ll be using Upsolver to optimize the data on S3 using a self-service and SQL-based data transformation interface, and to create structured tables that our analyst can immediately query in Athena.
Reference Architecture
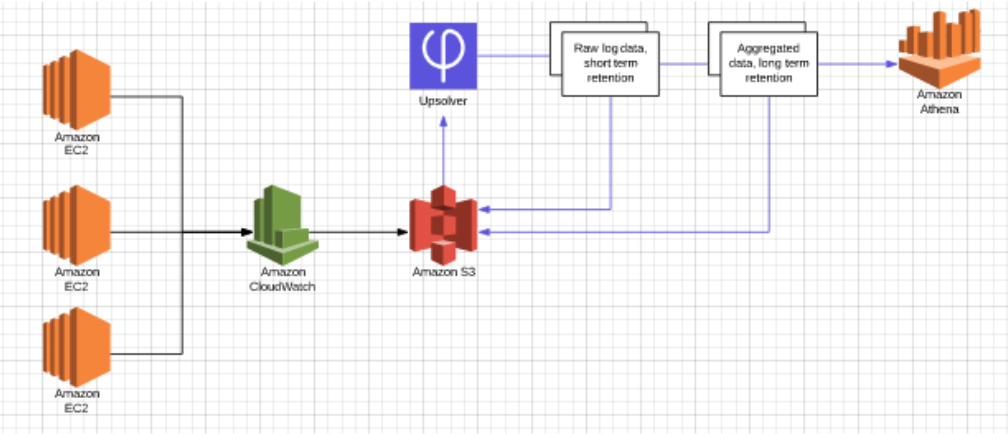
Solution components
- CloudWatch monitors multiple EC2 machines. The logs are stored on S3 using the native CloudWatch export S3 export functionality.
- We’ve defined an S3 Data Source in Upsolver to read the logs from S3.
- We’ve configured an aggregated Athena output in Upsolver. The output will be partitioned by time and aggregated by billed-duration. We will keep, per each hour the max memory-size used and a sum of the billed duration. As events stream in, we will update the data per hour and store it on S3. The data will be stored in S3 as compressed parquet files.
- To keep the cloud costs low – Upsolver enables you to configure retention on your data stored in S3 so you can store your data only as long as you need it and avoid storage waste. For the aggregated Athena output – we configure long retention (for example – 1 month). We will configure another Athena output in Upsoler with lower retention. This output will send all the raw data fields to Athena so you can query the raw data set for debug purposes. This output will be configured with low retention of 2 hours since it’s only being used to debug the hourly aggregations.
- Run the queries in Athena.
Next Steps
Want to unlock the true value of Amazon Athena? Schedule a demo of Upsolver to see how you can prepare petabyte-scale streaming data for analysis with a simple visual interface and SQL.
Want to master data engineering for Amazon Athena? Get the free resource bundle:
Learn everything you need to build performant cloud architecture on Amazon S3 with our ultimate Amazon Athena pack, including:
– Ebook: Partitioning data on S3 to improve Athena performance
– Recorded Webinar: Improving Athena + Looker Performance by 380%
– Recorded Webinar: 6 Must-know ETL tips for Amazon Athena
– Athena compared to Google BigQuery + performance benchmarks
And much more. Get the full bundle for FREE right here.