
Explore our expert-made templates & start with the right one for you.
3 Steps To Reduce Your Elasticsearch Costs By 90 – 99%
-
 Eran Levy
- Use Cases
- February 27, 2019
This article covers best practices for reducing the price tag of Elasticsearch using a data lake approach. Want to learn how to optimizing your log analysis? Check out A Data Lake Approach to Event Stream Analytics.
Elasticsearch is a fantastic log analysis and search tool, used by everyone from tiny startups to the largest enterprises. It’s a robust solution for many operational use cases as well as for BI and reporting, and performs well at virtually any scale – which is why many developers get used to ‘dumping’ all of their log data into Elasticsearch and storing it there indefinitely.
There’s nothing wrong with this m.o. when your log data is still in the hundreds-of-gigabytes territory. However, once you cross a certain threshold, and especially if you’re working in the Cloud (e.g. using AWS EC2 instances), keeping all of your raw data in Elastic is going to get extremely expensive.
Let’s understand why this happens and what you can do about it, and then show how we implemented this solution in a Data Lake approach using Upsolver.
Elasticsearch is a database, so costs scale linearly with data
Storing all of your logs in Elasticsearch is very easy to do and will not require any kind of custom coding, especially if you’re already using Logstash. However, in this setup, you’re essentially storing all of your raw data in a database (namely Elasticsearch) where storage and compute are coupled.
Basically, database storage is expensive. To make things worse, you need to store a lot more than the amount of logs you’re generating, including:
- Replicating all the data at least once for resilience
- Indices roughly double the size of the data
- Some free space needs to remain available, in case of growth in the data and for merge and rebalancing operations
To understand what this means in practice, let’s assume we’re working on AWS and generating one terabyte’s worth of log data. To store 1 TB of raw uncompressed data, we would need at least 2 data EC2 instances, each with around 4 TB of EBS storage (2x to account for index size, 50% free space) for a total of 8 TB of EBS storage, which costs $100/TB/month. Add the EC2 instance costs (2x r5.2xlarge), and we’re up to approximately $1500/month to store our single TB of data in Elasticsearch.
Taking into account that Elasticsearch logs are often text-heavy (e.g. website content) and hence relatively large, one terabyte is by no means a lot of data, and an organization that is heavily reliant on Elasticsearch is going to exceed these volumes by very much, very quickly.

The solution: store raw data in a data lake, send a subset to Elasticsearch
Clearly, using Elasticsearch as an event store is an expensive choice. However, there is an easy way around this issue, which begins with understanding you don’t need to store all of the data in Elasticsearch.
In fact, it’s likely that you can work with an aggregation as small as 1% of the size of your original data without giving up any of your use cases!
The two most common reasons that cause your raw data to become unnecessarily bloated are:
- Duplicate events: anyone who’s worked with log data has spent more time than they are happy to admit cleaning out duplicate events. Servers can generate a lot of identical or nearly-identical logs in a steady state, and production errors can cause a server to suddenly produce a huge amount of duplicate logs in a small period of time. While it might be important to keep track of these issues, only few of the actual logs are actually needed for further analysis. Deduplication can remove up to 90%.
- Redundant events: With application data the problem usually won’t be logs that are exactly identical, but rather that many logs of events that are not actually informative. If you’re trying to understand the way users interact with your SaaS or mobile application, you’d usually want to track a subset of the fields and then aggregate them, and not individual instances (for example, the first time a user’s browser loaded a webpage, rather than every single time the page was loaded).
By “weeding out” these non-useful logs and only sending the relevant ones to Elasticsearch, we can put a serious dent in our infrastructure costs. We’ll still be keeping all of the raw data for replay purposes and further analysis; but instead of storing it in the database, we will keep it in data lake storage – in our example, on Amazon S3 (to learn more about this type of approach, check out the 4 Key Components of a Streaming Data Architecture).
The advantage is that we are now paying for inexpensive object storage rather than EC2 instances. Since 10x compression is quite standard for logs, for the same uncompressed terabyte for which we had previously paid $1500 per month, we could now be paying as little as $2/month.
Using this method, most organizations can cut down 85-99% of the direct costs of their Elasticsearch cluster. To give you an idea, here’s an example provided by one of our customers in the AdTech space. These are the stats of a raw data stream coming in from Logstash.
Implementing the Solution
Let’s see how we can implement this type of solution with actual data – application logs coming in from Kinesis. We’ll be using the Upsolver streaming data platform to identify duplicate logs we can filter out and then send a reduced output stream to Elasticsearch. Not using Upsolver yet? Get a free trial here and follow along.
Step 1: Find removable logs
We can see schema, value distribution, and field names from the Kinesis stream using the Upsolver UI:
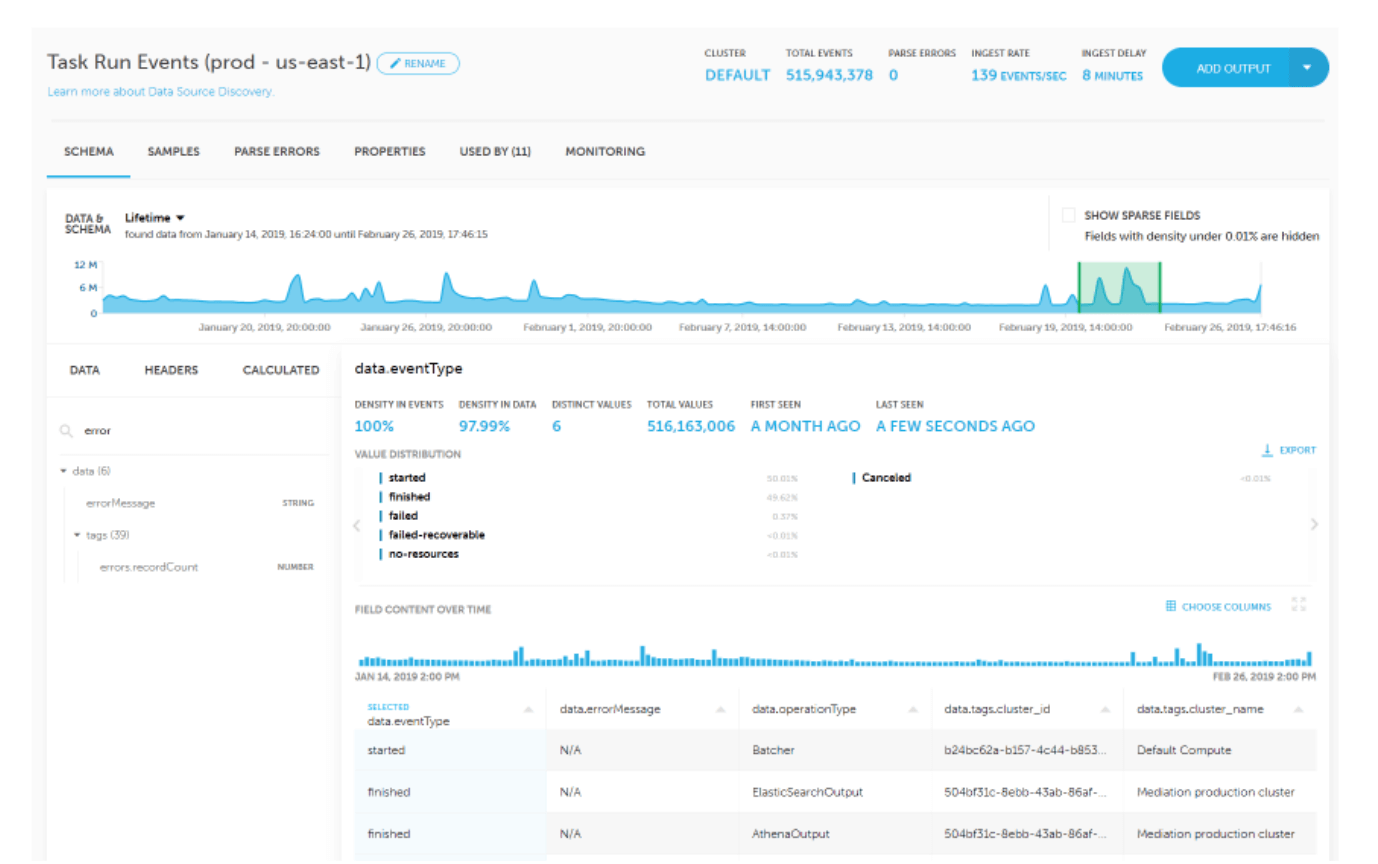
It’s clear that some types of errors repeat frequently. We might need this data for other purposes in the future, so we’ll store a copy of it on S3. But to keep our Elasticsearch costs under control we’re going to filter them out.
Step 2: Filter out the duplicates
We want to create a reduced output stream to Elasticsearch. After defining the output, we’ll use the Enrichment feature in order to add a calculated field to the stream, using the IS_DUPLICATE function:
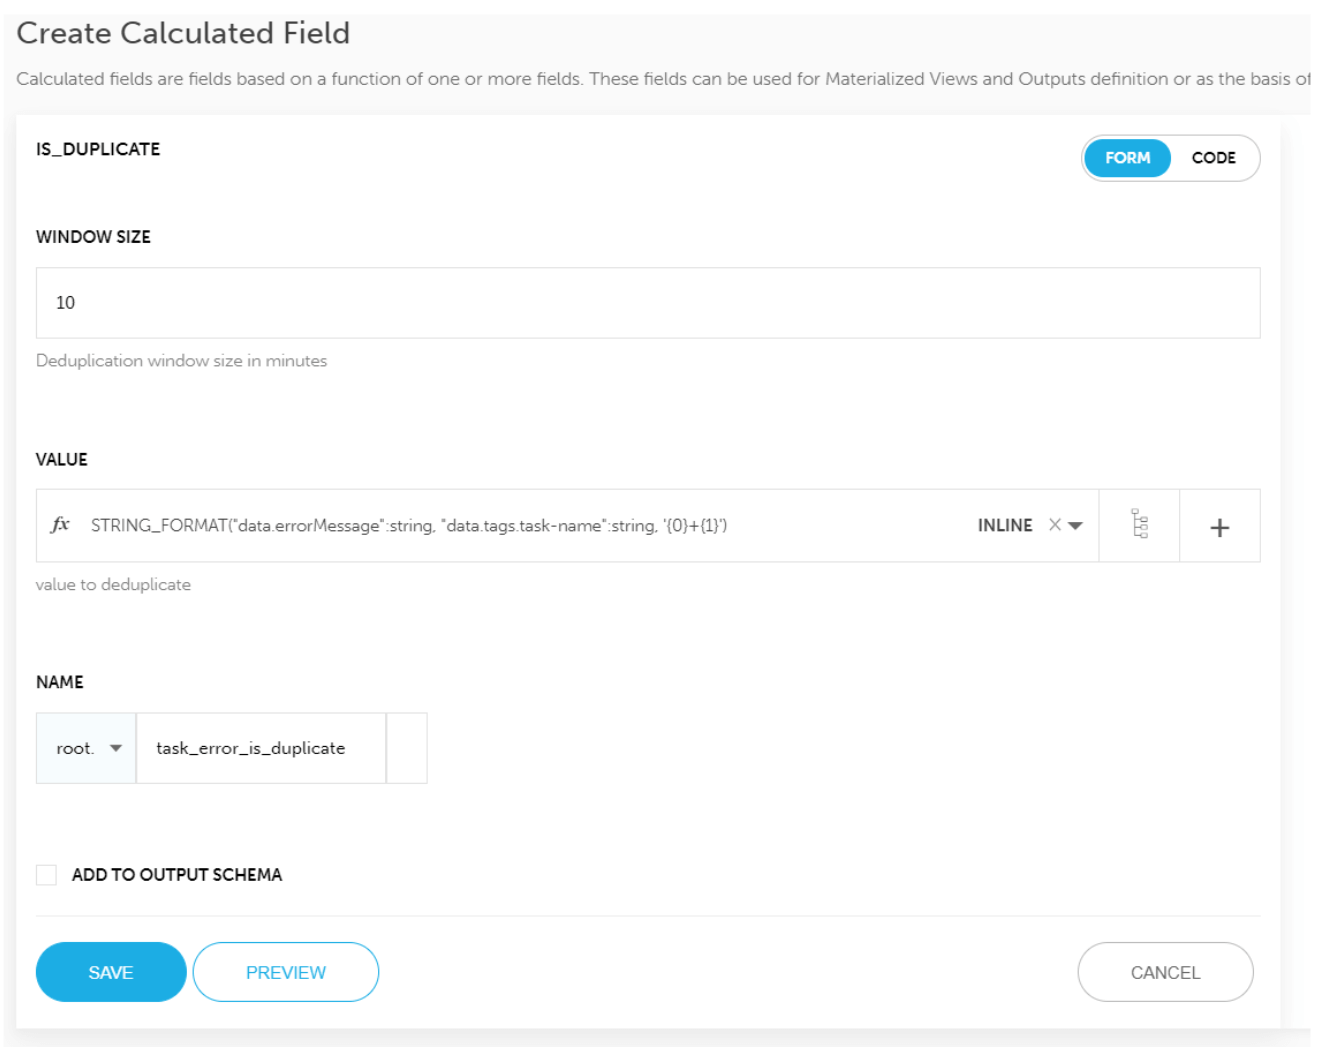
In the screenshot above, we are looking for duplicates in a 10 minute time window, within the data.errorMessage field (we combined the task name with the error message so we only dedupe the same error message from the same task).
After running this enrichment, the output stream will contain the field we have named task_error_is_duplicate, which will indicate events to filter out.
Step 3: Send reduced stream to Elasticsearch
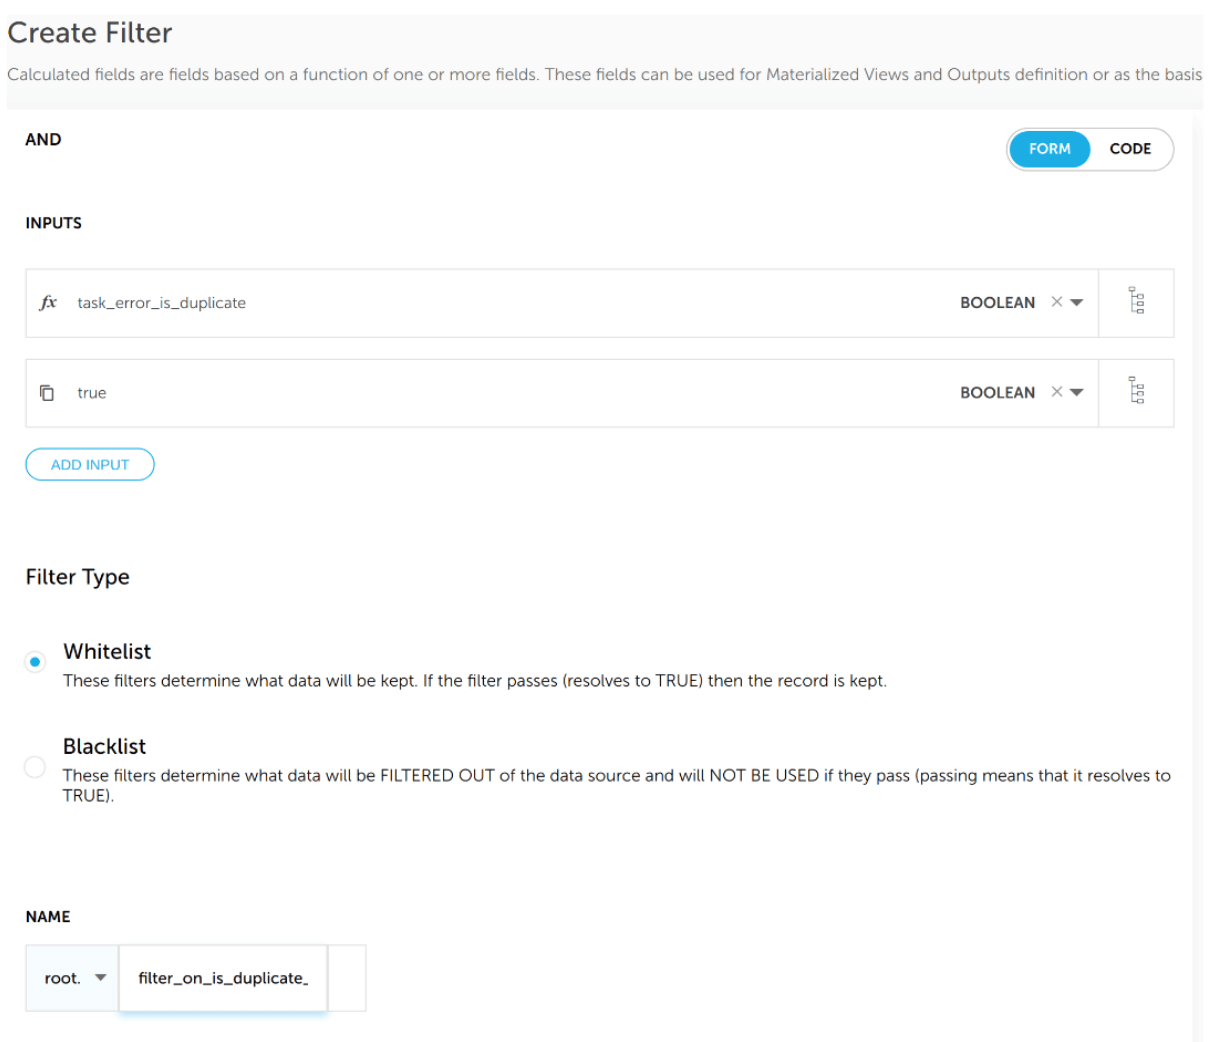
Now that we have earmarked the duplicate logs, all that’s left is to add a filter to the output stream to Elasticsearch, using the newly minted task_error_is_duplicate field to decide whether to include an event in the output. Doing this in Upsolver looks like this:
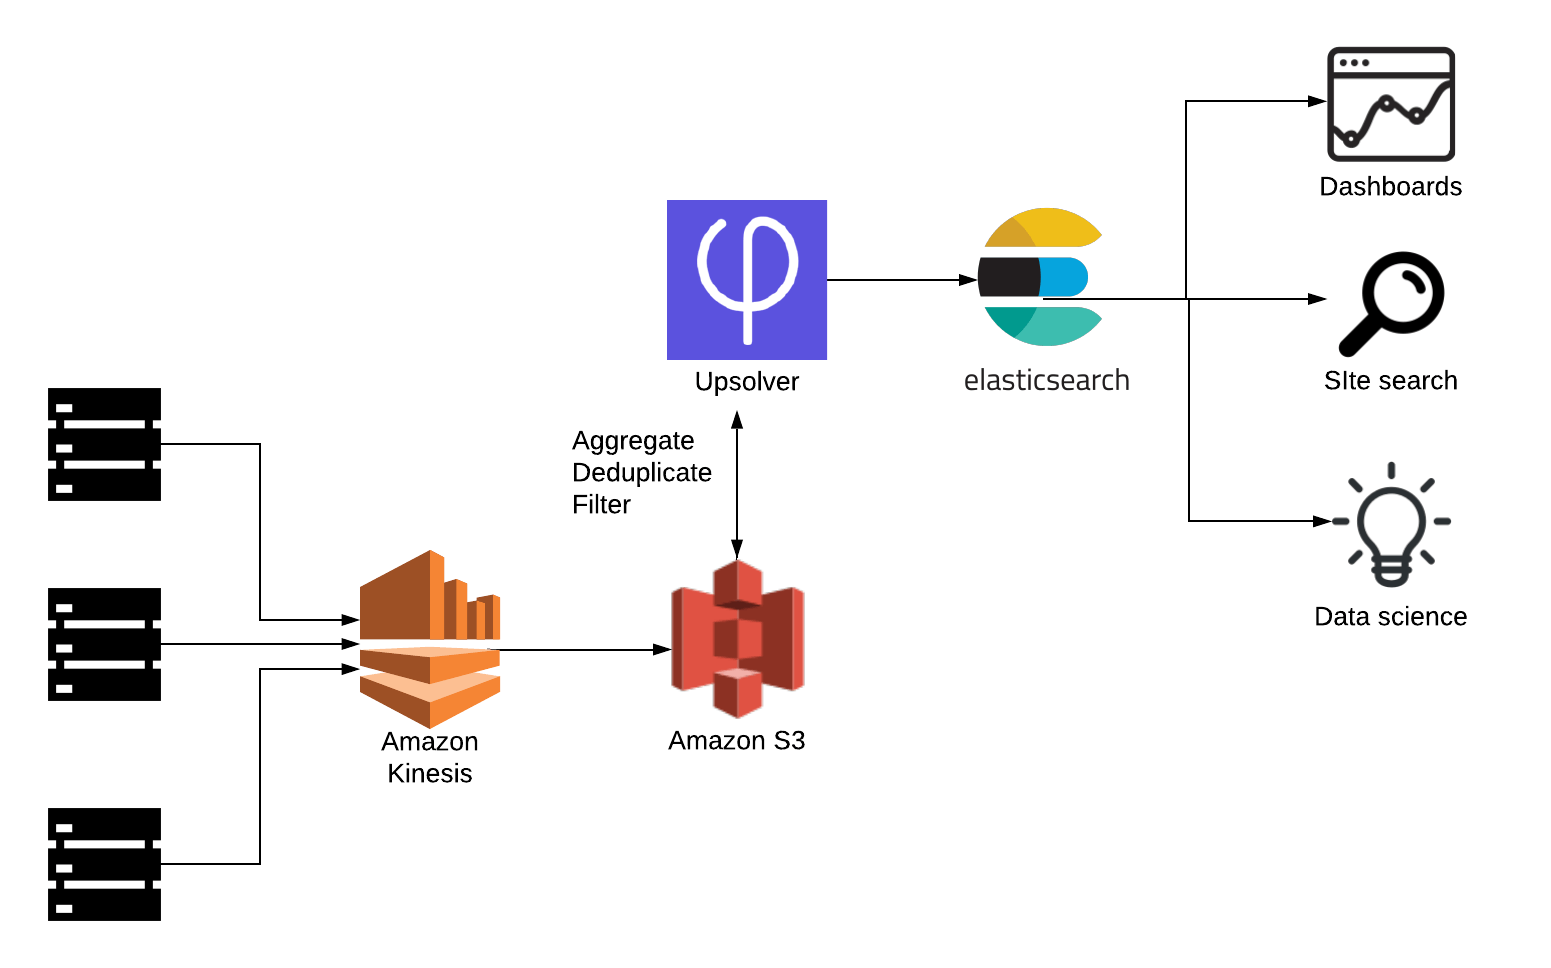
And voila! We’ve just eliminated a ton of noise and are also keeping the price of our Elasticsearch cluster under control. Because we’re working in a data lake architecture, we’re not losing the raw data in the process – instead, it is being stored on Amazon S3 for future use.
Reference Architecture:
Want to learn more?
- Learn how Meta Networks uses Upsolver, Elasticsearch and Amazon Athena to easily transform streaming data into usable information. Read the case study
- Check out our recent article on How to Reduce Your Data Platform Costs with Value-Based Pricing
- See some more examples of S3 data lakes
- See Upsolver in action, in your environment and on your data, in a guided 90 minute POC. Schedule an intro call
- Try SQLake for free (early access). SQLake is Upsolver’s newest offering. It lets you build and run reliable data pipelines on streaming and batch data via an all-SQL experience. Try it for free. No credit card required.