
Explore our expert-made templates & start with the right one for you.
Analyzing Amazon VPC Flow Logs Using SQL
-
 Jason Hall
- Use Cases
- January 6, 2023
Virtual Private Cloud (VPC) Flow Logs are a feature of the AWS infrastructure that captures information about the IP traffic going to and from your network resources. VPC Flow Logs can be used for a variety of purposes, including security monitoring, analyzing network traffic to servers and databases, diagnosing connectivity issues, and detecting potential security attacks. This post shows you how to configure your AWS environment to collect VPC Flow Logs and how to analyze them in a variety of ways using Upsolver SQLake.
With Upsolver SQLake you can write SQL that automatically turns into production grade, scalable data pipelines. SQLake manages all of the job dependencies (there’s no need to build and test Airflow DAGs), enforces best practices, and scales compute resources up and down to meet demand.
Time from initial ingestion to log analysis: 5-10 minutes
You can configure AWS VPC Flow Logs to write files to Amazon S3 containing the flow log information. Logs are aggregated at a configurable interval – typically 10 minutes and oftentimes 1 minute. Once logs are collected they are written to S3 in best effort but usually arrive within 5 minutes. You can store these logs in Apache Parquet format, partitioned by date to make querying them using Amazon Athena fast and cost effective.
AWS provides documentation on how to set up a simple integration with Amazon Athena. However, this integration is less than ideal because:
- You must configure and manage an AWS Lambda function to periodically update partitions in the AWS Glue Data Catalog. You also need to pay for this Lambda function.
- You can choose to configure AWS Glue crawlers to update the catalog but it includes additional effort and cost
- You need to manage your schema to ensure column names stored in the Parquet files do not break Athena’s column name exceptions
- Aggregation intervals of less than 10 minutes commonly result in small Parquet files which perform poorly and must be optimized. This compaction of small files is something left for you to manage or you’ll experience poor query performance after a few days of collecting logs.
How SQLake Helps Ingest and Prepare VPC Flow Logs
SQLake enables you to build a data pipeline to ingest, prepare, optimize, and update VPC Flow Logs using only SQL. SQLake automatically parses the Parquet data to extract the schema and partition information and updates the AWS Glue Data Catalog; there are no additional Lambda functions or Glue crawlers to manage. SQLake monitors the number and size of files in S3 and automatically compacts them, merging small files into larger ones, to continuously optimize your data for fast and efficient queries. All of this is done for you automatically, no additional configuration or tools to manage, and at no additional cost.
Because of the ease of use and automation provided by SQLake you can go from enabling VPC Flow Logs to analyzing them in under 10 minutes and with just a few lines of SQL.
Let’s get started!!
Enabling VPC Flow Logs
You can enable VPC Flow Logs at either the VPC or Subnet level.
- Enabling VPC Flow Logs for the entire VPC ensures that all network activity is tracked.
- Enabling flow logs at the subnet level reduces the amount of activity that is logged.
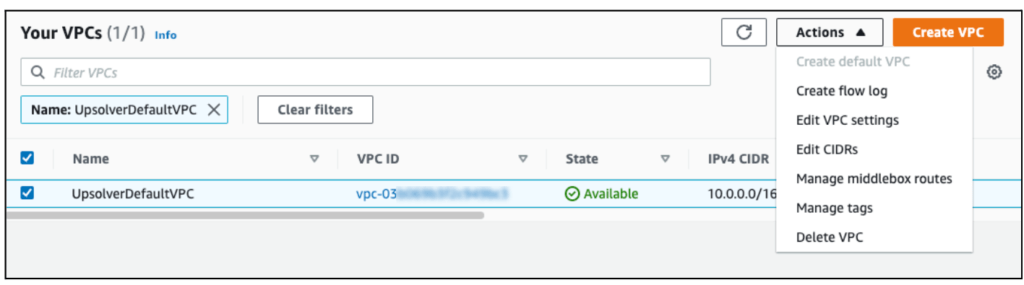
To enable VPC Flow Logs, first navigate to the VPC console of the AWS Console. Within the VPC console select the VPC for which you wish to enable Flow Logs. Then in the Actions menu click Create Flow Log:
In the form that displays, there are several parameters you must configure. You can learn more from the VPC Flow Log documentation. Pay particular attention to the following specific parameters:
- Maximum Aggregation Interval
- Destination
- Log record format
- Log file format
- Hive-compatible S3 prefix
- Partition logs by time
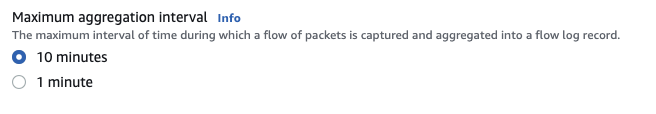
Maximum Aggregation Interval
Flow logs are aggregated over a maximum interval of either 10 minutes (default) or 1 minute based on this configuration. This means that for each interval, the number of network packets and bytes will be calculated over either a 10 minute window or a 1 minute window. Lowering the interval to 1 minute provides more granular analysis, but will generate potentially 10x the number of log records to analyze. Unless you’re certain you need 1 minute granularity, we recommend leaving this at the default of 10 minutes.
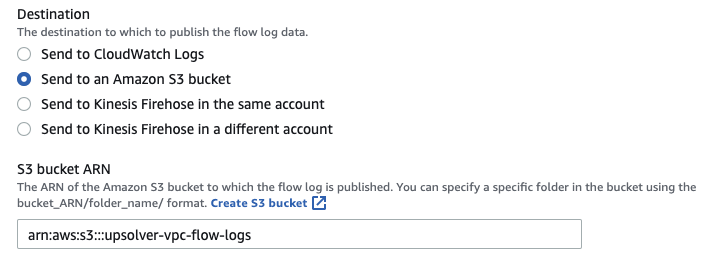
Destination
You can send flow logs to one of three different destinations: CloudWatch Logs, an S3 bucket, or Kinesis Data Firehose. In this example we will be sending our VPC Flow Logs to an Amazon S3 bucket. S3 provides a scalable, low cost storage mechanism that makes it possible to securely share flow log data to various processes.
You can create a new S3 bucket to store your VPC Flow Logs, or choose an existing bucket by entering it here. To use an existing bucket, you will need the ARN of the bucket. Find the ARN in the Buckets Properties tab from the S3 console:
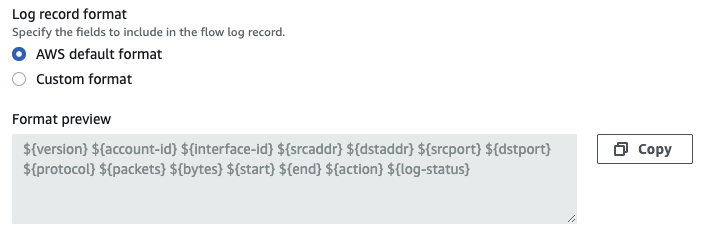
Log record format
AWS provides a default format of flow log records which you are encouraged to use. If you wish to define a custom format, you can do so here. But keep in mind that changing the format may impact any downstream processes that depend on the format used.
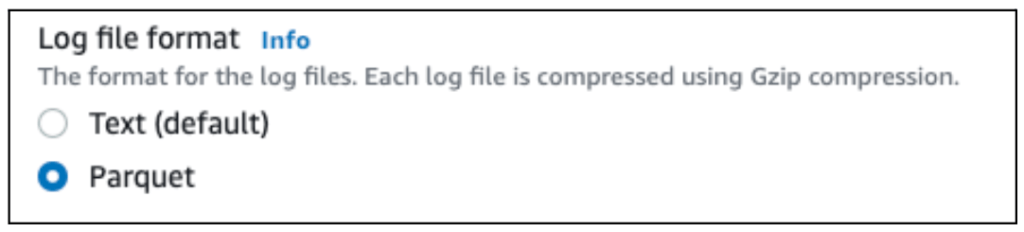
Log file format
Choose whether to store VPC Flog Log files in text or Parquet. We recommend Parquet for reasons of cost, as Parquet files are generally about 70% smaller than text files. SQLake makes it easy to work with Parquet files, so this format helps reduce the cost of storage when compared to text files.
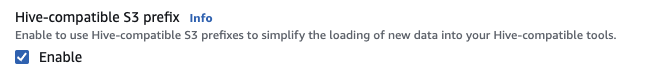
Hive-compatible S3 prefix
When writing flow logs to S3, this setting will create partitions that are Hive compatible. The partitions created will be of the format: year=2022/month=12/day=14
This setting helps make your S3 partitions more efficient to read by filtering unneeded files. It also ensures Hive compatibility with solutions such as SQLake, Apache Spark, and Apache Presto.
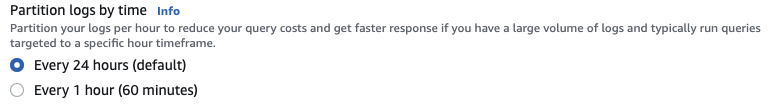
Partition logs by time
This setting configures how granular your S3 partitions will be. If you expect a significant log volume, and most of your queries will be aggregating within an hour, partitioning by hour may help to improve query performance. If you are unsure of your log volume and/or will be primarily reading these logs with SQLake, we recommend the default setting (every 24 hours). SQLake is more flexible and enables you to repartition the output tables containing your logs to better match your query requirements.
After you have filled out the form completely, click Create flow log to begin collecting log files:

Verifying Flow Log Configurations
If you are unsure whether VPC Flow Logs have already been configured for your VPC, or you just wish to confirm their configuration, you can view the Flow Logs tab of the VPC interface:
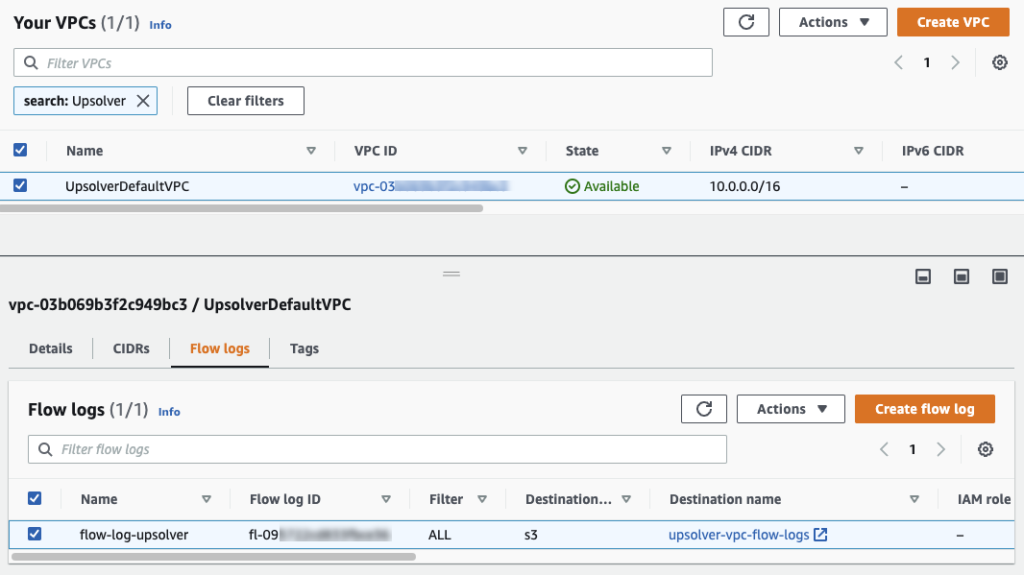
The Destination column of your flow log contains a hyperlink you can click to view the S3 bucket to which your logs are being written. As you navigate through your S3 bucket, you eventually reach the individual VPC Flow Log files, each stored as compressed Parquet. Each file can be downloaded, decompressed, and manually inspected, although most use cases will involve analyzing thousands of files at a time.
Using SQLake to Simplify Ingestion and Preparation of Flow Logs
As we indicated earlier in this post, VPC Flow Logs can contain a large number of events because they track network traffic between many servers and services in your VPC. This results in a large number of output files of varying sizes. Furthermore, the delivery of these logs to S3 is best effort, meaning that new data can arrive at any time. The amount of data, the size of each file, and the irregular delivery of files combine to make it difficult to quickly ingest, prepare, and deliver fresh analytics-ready logs – difficult, at least, without having to build tools and processes to manage the pipeline.
SQLake makes ingesting and preparing flow logs easier by:
- automatically parsing the incoming files to infer the schema.
- optimizing the ingestion of files as the volume and size of files change.
- continuously optimizing the log data in S3 for best performance.
In the remainder of this post we walk you through how to use SQLake to build a pipeline using SQL to ingest, prepare, and produce an analytics-ready table from VPC Flow Logs in just a few minutes. These steps assume you have already signed up for a SQLake account and have integrated SQLake into your AWS account.
When you’ve registered, logged in, and completed the integration, you’re ready to get started.
Getting Started Ingesting VPC Flow Log Files into SQLake
Ingesting VPC Flow Logs using SQLake involves 3 straightforward steps:
- Create a connection to the S3 bucket(s) where VPC Flow Logs are stored
- Create a staging table and job to ingest raw flow logs
- Query raw flow log data using Amazon Athena
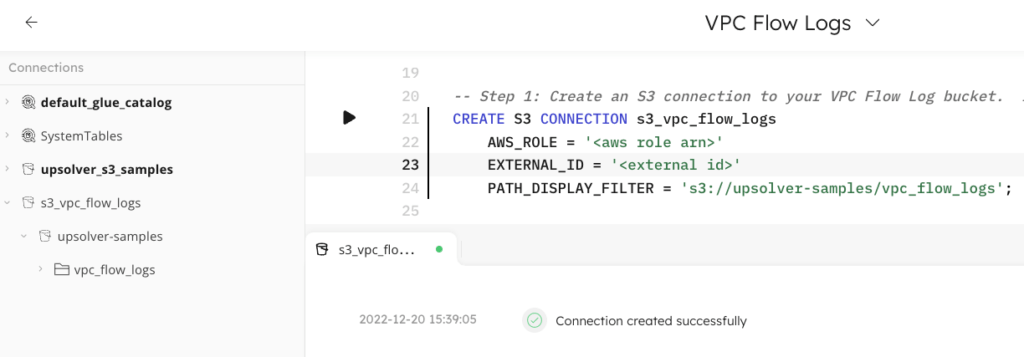
Step 1 – Create a connection to the flow log S3 bucket(s)
Connections to S3 in SQLake contain the authentication details needed to read data from your S3 buckets. Use the CREATE S3 CONNECTION command to define these connections.
You may be able to skip this step if the default role that was created when you deployed SQLake to your VPC has permissions to read data from your VPC Flow Log bucket, as a default S3 connection is already provided. If you must create a new S3 connection, use CREATE CONNECTION, enter the AWS_ROLE information used for the connection, and define the PATH_DISPLAY_FILTER(S) parameter to the specific bucket containing your VPC Flow Logs.
CREATE S3 CONNECTION s3_vpc_flow_logs
   AWS_ROLE = '<aws role arn>'
   EXTERNAL_ID = '<external id>'
   PATH_DISPLAY_FILTER = 's3://<flow log bucket>';
When the connection is created, SQLake displays the message “Connection created successfully” in your worksheet console. The connection is now visible in the navigation tree from the left-hand side:
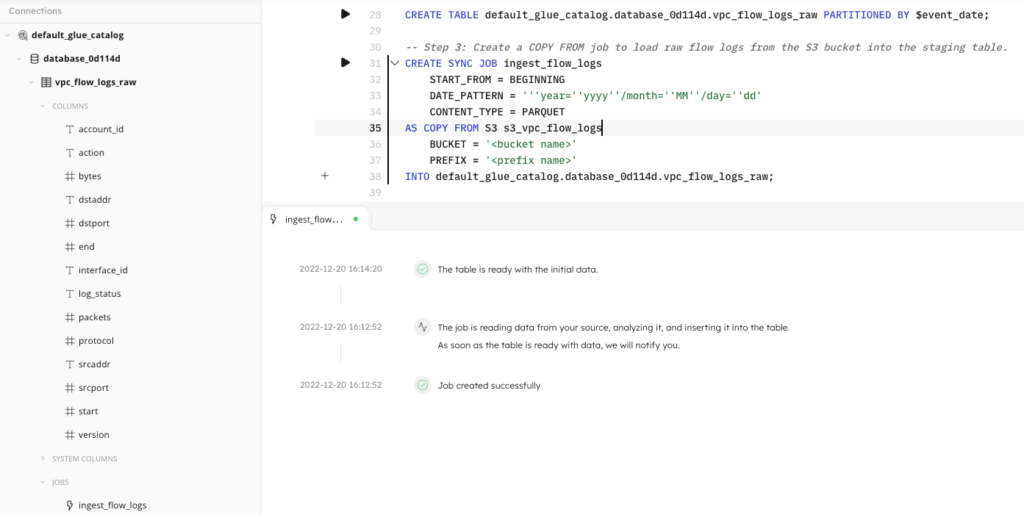
Step 2 – Create a staging table and job to ingest raw flow log files
Next, create a staging table in the data lake. This table will hold the raw flow log data. You do not need to define the schema of this table; SQLake automatically creates and updates the schema and partition information as it ingests data.
The CREATE TABLE command creates the staging table in your AWS Glue Data Catalog. You must update this command with the <catalog> and <db_name> in which you wish to create the table.
CREATE TABLE <catalog>.<db_name>.vpc_flow_logs_raw()
PARTITIONED BY $event_date;
In this example, we use the $event_date system column to partition the raw data, which SQLake automatically sets to the day the VPC Flow Log file was generated. By default, data is retained indefinitely. If you wish to apply a retention policy to this table you can do so using the TABLE_DATA_RETENTION = <N> DAYS parameter as shown below:
CREATE TABLE <catalog>.<db_name>.database_e809da.vpc_flow_logs_raw
PARTITIONED BY $event_date
TABLE_DATA_RETENTION = 30 DAYS;
Once the table is created, you must create an ingestion job that copies the raw flow log events from the source S3 bucket to the staging table in your data lake. SQLake automatically ingests both existing and new files as they arrive and continuously manages this data to ensure optimal query performance.
The following statement creates a SYNC JOB. Sync jobs are a unique feature of SQLake. They create strong dependency between each job in a pipeline. SQLake automatically understands the dependencies between jobs and ensures that data flowing between them remains in sync. This means that if any one job falls behind due to high processing load or delay in availability of data, the remaining jobs that depend on it will wait. This results in reliable delivery of correct data every time.
CREATE SYNC JOB ingest_flow_logs
   START_FROM = BEGINNING
   DATE_PATTERN = ’’’year=’’yyyy’’/month=’’MM’’/day=’’dd’
   CONTENT_TYPE = PARQUET
AS COPY FROM S3 s3_vpc_flow_logs
   BUCKET = '<bucket name>'
   PREFIX = '<prefix name>'
INTO <catalog>.<db_name>.vpc_flow_logs_raw;
Adjust the following parameters as necessary; consult the documentation for more detail:
START_FROM = BEGINNING | NOW | TIMESTAMP ‘<timestamp>’
The START_FROM parameter defines how much (if any) historical flow log data you wish to ingest from your S3 bucket. Setting START_FROM = BEGINNING tells the job to read all historical data from as far back as the data in the bucket goes. START_FROM = NOW tells the job to start reading from the time the job was created, ignoring all historical data. Alternatively, you can pick a specific point in time from which to start ingesting; to do this, set START_FROM = TIMESTAMP ‘<timestamp>’. The timestamp should be in a format such as: '2022-12-13 17:19:00'
DATE_PATTERN = ‘<pattern>’
The DATE_PATTERN property provides SQLake a hint about how data is organized in S3. When you enable a Hive-compatible S3 prefix for your flow log output, use this property to define the expected folder structure in S3. The pattern used in the CREATE JOB statement assumes the default flow log structure of year/month/day as shown below:
DATE_PATTERN = ’’’year=’’yyyy’’/month=’’MM’’/day=’’dd’
If you are using 1-hour partitioning with Hive-compatible S3 prefixes, you can modify the pattern to look like this:
DATE_PATTERN=’’’year=’’yyyy’’/month=’’MM’’/day=’’dd’’/hour=’’HH’
If you are not using Hive compatible S3 prefixes, make sure the DATE_PATTERN parameter matches the folder structure in your S3 bucket.
After you’ve successfully created the staging table and data ingestion job, SQLake displays updates in your worksheet console to indicate that data ingestion has begun. SQLake will post an update in the console notifying you when the initial data has been ingested and is ready to query. At this point you can also see your staging table in the navigation tree on the left, along with the columns that have been detected from the flow logs.
That’s it, you’re done!! You connected to the flow logs source bucket, created a data lake table to hold the ingested logs, and ran a job that copies raw logs, optimizes them, and stores them in a fully-managed data lake table that you can query with Athena and any other data lake-compatible query engine. It only took a couple minutes and a few lines of SQL code to complete; SQLake took care of all the heavy lifting, best practices, and maintenance for you.
Expanding on what you learned: when you are building a security data lake, you will most likely be collecting flow logs from multiple AWS accounts and regions. You can repeat steps 1 and 2 above to ingest other flow log data into your security data lake. A unique feature of SQLake is that if your ingestion jobs are consuming raw events from different buckets and are configured to insert into the same staging table, SQLake will automatically merge all logs into that single table. This makes the task easier – you don’t need to manage many different tables, join across them, or create additional jobs to union the data. You get a common view into all of your flow logs from a single table.
Step 3 – Query raw flow logs using Amazon Athena
After the initial flow logs have been ingested, you can begin querying the log data via SQLake’s built-in Amazon Athena integration. To do this you can use either Athena directly or any other data lake compatible query engine. Since SQLake automatically ingests new files as they are created, your queries always return the most recent results.
Here is an example of a query that displays the top 10 source IP addresses by the total number of network packets over the past hour:
SELECT srcaddr, sum(packets) as num_packets
FROM default_glue_catalog.database_0d114d.vpc_flow_logs_raw
WHERE FROM_UNIXTIME(start) > CURRENT_TIMESTAMP - INTERVAL '1' HOUR
GROUP BY srcaddr
LIMIT 10;
Filtering your VPC Flow Logs
For certain types of analysis, it may not be necessary to analyze every column and every event from your raw flow logs. By filtering your raw logs, you can dramatically reduce the amount of data to be scanned when performing analysis. This results in better query performance and more responsive dashboards.
SQLake allows you to create jobs that read from data lake staging tables, transform the data and write the results to a variety of destinations, like data lake, Snowflake, Redshift and Elasticsearch. These jobs are easy to build because you write them as you would a SQL query.
For the analysis in the example we’ve been using, let’s assume you decide you only require the following columns:
- Srcaddr (source IP address)
- Dstaddr (destination IO address)
- Start (start time of the log record)
- End (end time of the log record)
- Packets (number of network packets transmitted)
- Bytes (number of bytes transmitted)
You can write your transformation SQL query as per the below example, including those 6 columns, and filter out the rest:
SELECT
	srcaddr,
	dstaddr,
	start,
	end,
	packets,
	bytes
FROM <catalog>.<db_name>.vpc_flow_logs_raw;
In addition to selecting specific columns, you can also filter the events themselves by including a WHERE clause in your SQL. For example, if the purpose of your transformation is to analyze the network utilization, you may only care about network sessions with an action of ‘ACCEPT’. Adding this WHERE clause to the above SQL gives us the following:
SELECT
	srcaddr,
	dstaddr,
	start,
	end,
	packets,
	bytes
FROM <catalog>.<db_name>.vpc_flow_logs_raw
WHERE action = 'ACCEPT';
To turn this transformation SQL query into a job using SQLake, start by creating a target table into which you’ll store the filtered results of the transformation:
CREATE TABLE <catalog>.<db_name>.vpc_flow_logs_filtered_success (
  partition_date date
)
PARTITIONED BY partition_date;
Next, create a transformation job to read the raw flow log data, select only specific columns, and filter out uninteresting events. Then write the results into the target table. In the job below, we’ve also leveraged the EXTRACT_TIMESTAMP() function to convert the start and end columns into proper timestamps.
CREATE SYNC JOB vpc_flow_logs_filtered_success
  START_FROM = BEGINNING
  RUN_INTERVAL = 1 MINUTE
  ADD_MISSING_COLUMNS = TRUE
AS INSERT INTO <catalog>.<db_name>.vpc_flow_logs_filtered_success
MAP_COLUMNS_BY_NAME
SELECT
 srcaddr,
 dstaddr,
 EXTRACT_TIMESTAMP(TO_STRING("start")) as start_timestamp,
 EXTRACT_TIMESTAMP(TO_STRING("end")) as end_timestamp,
 bytes,
 packets,
 $event_date as partition_date
FROM <catalog>.<db_name>.vpc_flow_logs_raw
WHERE action = 'ACCEPT'
 AND $event_time BETWEEN RUN_START_TIME() AND RUN_END_TIME();
Notice that the SELECT clause is almost identical to the SQL query we’ve experimented with above. You can create additional transformations in a similar manner by modifying the SELECT clause to include or exclude columns, use built-in functions, and modify the WHERE clause to filter specific log records.
Additional use cases for filtered transformations may include (examples in appendix):
- Filtering based on list of approved/rejected network ports
- (that is, RDP – 3389, SSH – 22, MYSQL – 3306, and so on)
- Filtering activity on specific IP addresses or IP ranges
Aggregating Your VPC Flow Logs
Depending on how you have configured your VPC Flow Logs, the events contained are aggregated by either 10 minute intervals (default) or 1 minute intervals. For certain use cases, a less granular aggregation window may be reasonable, and can dramatically reduce the amount of data being processed. For example, if your flow logs use a 10 minute aggregation, and your analysis requires daily aggregates, querying the pre-aggregated data would process 144x less data than querying the raw data every time you need to aggregate.
Creating an aggregated transformation in SQLake is as simple as adding a GROUP BY clause to your transformation SQL. This clause defines the columns by which you wish to aggregate along with the aggregate functions to apply.
First, create the table that will store the aggregated results of the transformation:
CREATE TABLE <catalog>.<db_name>.vpc_flow_logs_aggregated_daily (
  partition_date date
)
PARTITIONED BY partition_date;
Next, create a transformation job to read the raw flow log data, and aggregate the results via the SQL GROUP BY clause. The RUN_INTERVAL parameter of the job should match the time range over which you wish to aggregate – 1 DAY in this example.
CREATE SYNC JOB vpc_flow_logs_aggregate_daily
  START_FROM = BEGINNING
  RUN_INTERVAL = 1 DAY
  ADD_MISSING_COLUMNS = TRUE
AS INSERT INTO <catalog>.<db_name>.vpc_flow_logs_aggregated_daily
MAP_COLUMNS_BY_NAME
SELECT
 srcaddr,
 dstaddr,
 MIN(EXTRACT_TIMESTAMP(TO_STRING("start"))) as start_timestamp,
 MAX(EXTRACT_TIMESTAMP(TO_STRING("end"))) as end_timestamp,
 SUM(bytes) as bytes,
 SUM(packets) as packets,
 $event_date as partition_date
FROM <catalog>.<db_name>.vpc_flow_logs_raw
WHERE action = 'ACCEPT'
 AND $event_time BETWEEN RUN_START_TIME() AND RUN_END_TIME()
GROUP BY srcaddr, dstaddr, $event_date;
With this transformation now running, you can execute a report analyzing daily network traffic over the past 90 days, while scanning 144x less data compared to executing this aggregation query against the raw flow log data.
You can build additional transformation jobs in SQLake that produce use case-specific tables. This is often helpful when creating dashboards used by different teams that require different slices and aggregations of the data. Instead of trying to keep one large table for everyone and ask them to build their business logic in the visualization layer, create transformation jobs that centralize the business logic in the data pipelines. This is easier to manage, can be version controlled, is simple to reuse and audit, and overall can be more cost effective.
Summary – Analyzing VPC Flow Logs with SQLake
VPC Flow Logs enable you to collect and analyze important information about network traffic inside of your AWS VPC. It can be daunting to build a security data lake that consolidates flow logs from multiple accounts and regions, continuously ingests new data, and updates schemas and partition information – all while also optimizing the data for best performance. In this post, you learned how SQLake enables you to quickly and easily ingest, prepare, and produce analytics-ready flow logs with only a few lines of SQL.
Try SQLakefor Free – Unlimited 30-Day Trial
Try SQLake for free for 30 days. No credit card required. Use your own data, or our sample data.
Visit our SQLake Builders Hub, where you can learn more about how SQLake works, read technical blogs that delve into details and techniques, and access additional resources.
Or continue the discussion and ask questions in our Slack Community.
Appendix – Additional Ad Hoc Queries and Transformations
Use Case 1: Find the top IP address pairs (source -> target) that have had their connections rejected.
Direct query against raw data:
SELECT srcaddr || '->' ||
      dstaddr as ip_pair,
      "action",
      count(*) count
FROM default_glue_catalog.database_11f174.vpc_flow_logs_raw
   WHERE "action" = 'REJECT' AND "$event_time" > current_date - interval '1' day
   GROUP BY 1, 2
   ORDER BY count desc LIMIT 25;
Aggregated transformation:
CREATE TABLE default_glue_catalog.database_11f174.vpc_daily_rejected_traffic(ip_pair string, partition_date date)
 PRIMARY KEY ip_pair
 PARTITIONED BY partition_date
 TABLE_DATA_RETENTION = 3 DAYS;

CREATE SYNC JOB vpc_load_daily_rejected_traffic
   START_FROM = BEGINNING
   ADD_MISSING_COLUMNS = TRUE
   RUN_INTERVAL = 1 DAY
AS INSERT INTO default_glue_catalog.database_11f174.vpc_daily_rejected_traffic MAP_COLUMNS_BY_NAME
SELECT ip_pair,
      "action",
      count(*) as num_rejects,
     $event_date as partition_date
FROM default_glue_catalog.database_11f174.vpc_flow_logs_raw
  LET ip_pair = COALESCE(srcaddr, 'null') || '->' || COALESCE(dstaddr, 'null')
WHERE $event_time BETWEEN run_start_time() AND run_end_time()
 AND "action" = 'REJECT'
GROUP BY ip_pair, "action", $event_date;
Use Case 2: Calculate the top IP address pairs (source -> target) per hour, by network bandwidth consumption.
Direct query against raw data:
SELECT
   srcaddr || '->' || dstaddr as ip_pair,
   DATE_TRUNC('hour',"$event_time") as log_hour,
   sum(bytes) as sum_bytes,
   sum(packets) as sum_packets,
   count(*) as num_connects
FROM default_glue_catalog.database_11f174.vpc_flow_logs_raw
GROUP BY 1, 2
ORDER BY sum_bytes DESC
LIMIT 50;
Aggregated transformation:
CREATE TABLE default_glue_catalog.database_11f174.vpc_top_ip_pairs(ip_pair string, port_pair string, partition_date date)
   PRIMARY KEY ip_pair
   PARTITIONED BY partition_date
   TABLE_DATA_RETENTION = 3 DAYS;

CREATE SYNC JOB vpc_flow_logs_top_pairs
   START_FROM = BEGINNING
   RUN_INTERVAL = 1 HOUR
   ADD_MISSING_COLUMNS = TRUE
AS INSERT INTO default_glue_catalog.database_11f174.vpc_top_ip_pairs MAP_COLUMNS_BY_NAME
SELECT
   ip_pair as ip_pair,
   DATE_TRUNC('hour',$event_time) as log_hour,
   $event_date as partition_date,
   sum(bytes) as sum_bytes,
   sum(packets) as sum_packets,
   count(*) as num_connects
FROM default_glue_catalog.database_11f174.vpc_flow_logs_raw
   LET ip_pair = COALESCE(srcaddr, 'null') || '->' || COALESCE(dstaddr, 'null')
WHERE $event_time BETWEEN RUN_START_TIME() AND RUN_END_TIME()
GROUP BY 1,2,3;
Use Case 3: Identify the IP addresses creating the most traffic per day
Direct query against raw data:
SELECT srcaddr, sum(bytes) as bytes
   FROM default_glue_catalog.database_11f174.vpc_flow_logs_raw
   WHERE "$event_time" > current_date - interval '1' day
GROUP BY srcaddr
ORDER BY bytes desc limit 50;
Aggregated transformation:
CREATE TABLE default_glue_catalog.database_11f174.vpc_daily_top_ips(srcaddr string, partition_date date)
 PRIMARY KEY srcaddr
 PARTITIONED BY partition_date
 TABLE_DATA_RETENTION = 3 DAYS;

CREATE SYNC JOB load_daily_top_ips
   START_FROM = BEGINNING
   ADD_MISSING_COLUMNS = TRUE
   RUN_INTERVAL = 1 DAY
   AS INSERT INTO default_glue_catalog.database_11f174.vpc_daily_top_ips
   MAP_COLUMNS_BY_NAME
SELECT
   srcaddr,
   DATE_TRUNC('day',EXTRACT_TIMESTAMP(TO_STRING("start"))) as partition_date,
   sum(bytes) as sum_bytes
 FROM default_glue_catalog.database_11f174.vpc_flow_logs_raw
 WHERE
   $event_time BETWEEN run_start_time() AND run_end_time()
 GROUP BY 1, 2;