
Explore our expert-made templates & start with the right one for you.
Splunk vs. Elastic Stack (ELK): Making Sense of Machine Log Files
-
 Upsolver Team
- Cloud Architecture
- November 17, 2020
The runtime verification of computer hardware and its ability to interact with the user via a software interface are critical aspects of information technology management. In other words, if the hardware, software, and user interactions are not optimal, the consequences, as seen by our case study, will ultimately result in the breakdown in the hardware or software.
The most critical hurdle the runtime verification field faces is ensuring that the overheads required to run a software application are kept as low as possible. This is relevant for every instance where hardware and software interrelate. However, it is particularly crucial in embedded applications where memory and CPU are limited.
Consequently, it is essential to utilize machine logging to monitor hardware elements like memory and CPU usage and the interactions between hardware and software in a distributed enterprise server architecture.
Therefore, the question that begs is, how do IT engineers monitor the hardware, software, and user relationships to ensure optimal functioning of the system as a whole?
The brief answer to this question is to monitor machine log files for any anomalies.
Machine Log Files: What, Why, and How
Techopedia.com defines machine log files as files that “keep a registry of events, processes, messages and communication between various communicating software applications and the operating system.”
These log files are produced by every executable program on a computer system, including software, operating systems, and other programs where every activity performed by the program is recorded.
It stands to reason that the bigger the server architecture, the greater the number of log files produced. It is impossible to monitor these log files manually. There are too many, and it is not feasible for the IT engineer to read each log file individually.
As a result, it is imperative to implement an automated solution, including the capacity for the implementation of machine learning algorithms, that automatically monitors these log files in near real-time to ensure that the hardware and software interact optimally at all times.
What tools (software) can be used to automate the machine log monitoring process?
Enter Elastic Stack (ELK) or Splunk.
ELK is a stack of open-source programs, Elasticsearch, Logstash, and Kibana, designed to implement the “ability to aggregate logs from all your systems and applications, analyze these logs, and create visualizations for application and infrastructure monitoring, faster troubleshooting, security analytics.”
Juxtapositionally, Splunk is a proprietary software platform widely used to monitor, search, analyze, and visualize machine-generated data in real-time.
The Commonalities and Dissimilarities between ELK and Splunk: A Case Study
Let’s assume that you are the IT executive for one of the largest global eCommerce platforms outside of Amazon. The eCommerce platform sits on a distributed enterprise server system hosted in the cloud.
Black Friday sales are fast approaching, and forecast data demonstrates that there will be record numbers of visitors to the company’s eCommerce site. 2020 has been a complicated year for global retailers. And C-Suite management has mandated that the eCommerce platform must function optimally for the rest of 2020, through the Black Friday sales and the Christmas shopping.
How do you monitor the servers to ensure that everything runs smoothly?
The basic answer to this question is to pay attention to the machine log files. A distributed enterprise server stack generates hundreds of thousands, if not millions of log files over time. It is impossible to analyze these files without implementing an automated machine learning ecosystem.
You have one of two choices: Implement an open-source ELK stack or pay for a proprietary Splunk system.
Asaf Yigal of devops.com notes that both Spunk and Elk are considered the “big two in the log analytics world.” In other words, both are designed to store and analyze machine logs by offering a different approach to solving the same problem.
Deciding which solution to choose, decision-makers must consider their company’s organizational structure and how much time they have to devote to the analysis of log files.
Before we discuss the commonalities and dissimilarities between both of these options, let’s consider each option’s structure and how they collect, analyze, and visualize data.
ELK Explained
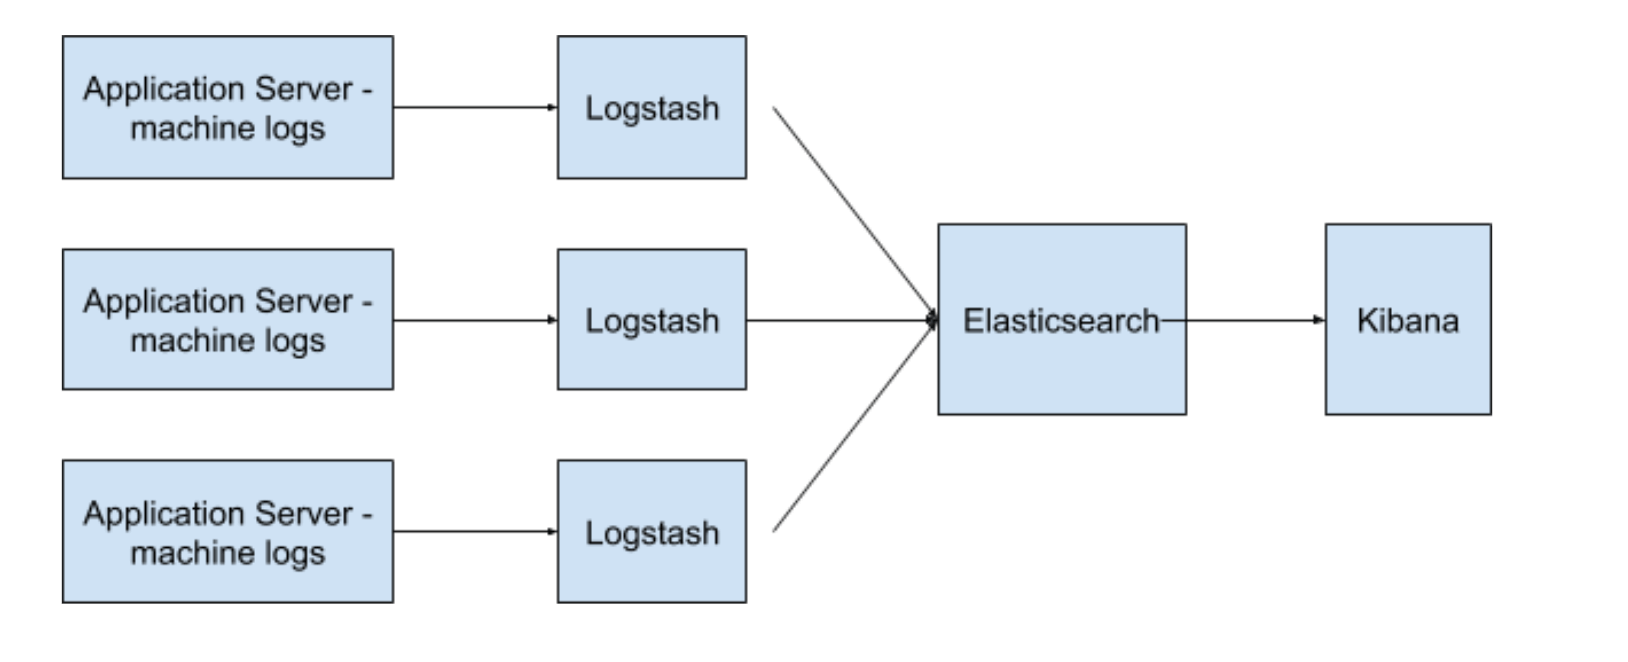
As highlighted above, the ELK stack is a distributed architectural model and is made up of three open-source products, Elasticsearch, Logstash, and Kibana, all developed and maintained by Elastic. It is massively distributed, scalable, and is an almost real-time data search solution.
Elasticsearch is the stack’s search engine. It is based on the Apache Lucene search engine.
Logstash collects the data on the fly, transforms it, and sends it to Elasticsearch along its data pipelines. This data populates Elasticsearch.
And finally, Kibana is the ELK stack’s data analysis visualization tool. Kibana fetches the data from Elasticsearch and transforms it into useful information via its charting and graphing user interface.
Splunk Explained
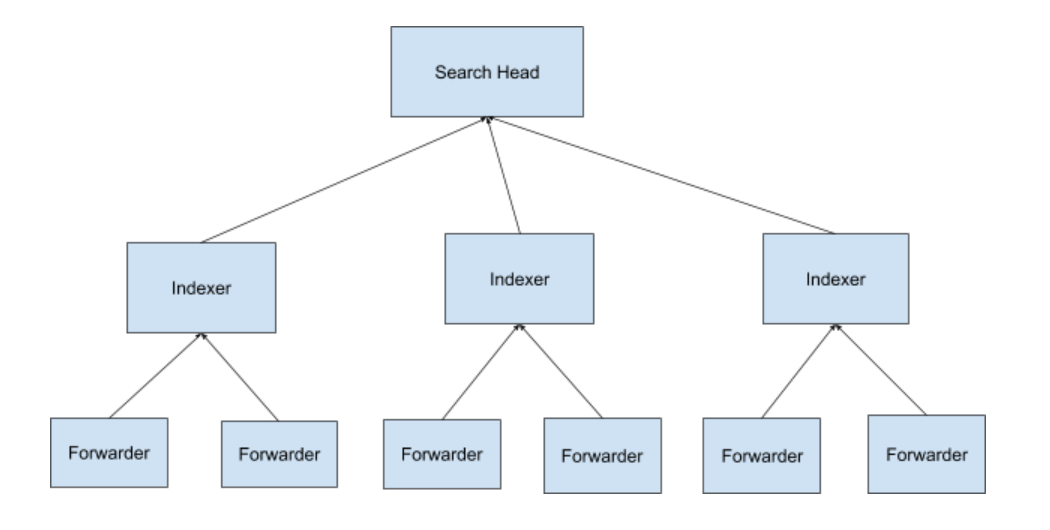
Splunk is made up of three components, the indexer, forwarder, and search head.
The forwarders collect data (in our case, machine log files) from different sources and pass the raw data to the indexer.
The indexers store and turn this data into events. They also generate metadata files so that the search head can execute the user queries.
Elk vs. Splunk
Many log files are unintelligible to the human brain. They consist of lines of seemingly meaningless alphanumeric characters. Splunk’s machine learning algorithms are used to train Splunk to understand and interpret these files.
For instance, in our eCommerce platform scenario, a log is written every time the website (front end) queries the product category, item, and price tables in the database. The speed at which the database returns the results is paramount to the eCommerce platform’s success.
Let’s assume that the average time it should take to perform this action is 0.10 seconds. You need to know if this time increases. It will slow down the website’s product page load, raising the website’s bounce rate. The best way to monitor the product load times is to set up an alert in either Splunk or ELK and train the machine learning algorithm to monitor each transaction’s load time, alerting you if and when this load time increases.
Setting Up the Data Sources
One of the most significant differences between these two architectures is that Splunk is easier to set up and manage than ELK. The core function of loading the data into each platform’s search engines is simple in Splunk but not so simple in ELK.
After Splunk is installed, setting up the forwarders and data pipelines is not tricky. Splunk comes with pre-configured templates.
Juxtapositionally, setting up and configuring the Elk stack requires the knowledge of a scripting language like Bash, Ruby, or Python. As an aside, the other option is to use Beats.
What are Elasticsearch Beats?
In summary, Beats are data collection modules or agents that are lightweight, purpose built, and are designed to collect data and forward it to Elasticsearch.
Data visualizations
Both Splunk and ELK include a dashboard-type interface with visualizations of aggregated data.
The Splunk interface is a web-based user interface that allows users to add and edit dashboard components. Each user has access to a different customizable dashboard.
Kibana is the ELK stack visualization tool. It has a similar web user interface to Splunk. However, it does not offer individualized user management.
Search
The search functionality is key to both options. Both Splunk and Kibana have a dedicated search field at the top of the web UI. Users of both need to learn the scripting languages required to perform in-depth searches. Splunk has a proprietary search language (Splunk Search Processing Language (SPL)) while Kibana uses the standard Apache Lucene query syntax, which is easier to learn than SPL.
Finally, Splunk has a built-in dynamic data exploration function, allowing users to extract everything from the raw data because Splunk’s indexer turns every data component into a searchable field.
On the other hand, the ELK equivalent is not as intuitive and easy-to-use. It needs to be configured in advance to utilize the aggregation facility of all machine log properties.
Final Thoughts
In summary, both Splunk’s and ELK’s primary goal is to monitor, analyze, aggregate, and visualize machine log files. However, there are a few pertinent differences. Namely, Splunk is a more elegant solution with a superior user interface, but buying user licenses is costly.
Kibana’s data visualizations are less elegant, but it is open-source; thus, there is no user licensing cost.
The processing power and functionality between Splunk and ELK are similar. ELK requires more work and planning to set up at the outset of the implementation process, but Kibana’s data extraction and visualization are more user-friendly than Splunk’s.
Finally, the answer to whether to implement ELK or Splunk is based on which product best fits the company’s organizational goals.
Published in:
Blog
,
Cloud Architecture