
Explore our expert-made templates & start with the right one for you.
Clickstream Analysis with SQL: a Step-by-Step Guide
-
 Chandra Peddireddy
- Building Data Pipelines
- October 26, 2022
Ad tech is an extremely competitive industry, where companies strive to match the right ad to the right user at the right time, and do it all as quickly as possible. To accomplish this, ad tech companies must ingest high volumes of data, typically millions of events per second, really fast. Then they must transform and enrich all that data so it can be fed into advanced machine learning (ML) models that determine the best bid strategy within a few milliseconds.
The “magic sauce” is in analyzing which apps people installed, their recent browsing history, and their engagement (making a purchase, liking and sharing a post, and so on) – then combining this data with comprehensive demographic information to uncover insights, optimize bid targets, create accurate revenue forecasts, and make impactful decisions — all at millisecond latency.
But adtech data requirements are complex. Clickstream data flows in at volumes averaging 5M events per second. User sessions span hours and even days and cross multiple devices such as mobile phones, computers, and tablets. This results in trillions of rows spread across hundreds of high-cardinality data sets.
Upsolver SQLake is designed to meet the grueling demands of ad tech data. SQLake enables users to build data pipelines using SQL on both streaming and batch data. It simplifies and accelerates the implementation of ad tech use cases such as campaign profitability, geotargeting, bid optimization, and so on. Below I examine SQLake’s approach to one such use case – ad performance reporting – and show how to use SQLake to implement it in a few minutes using only SQL.
Digital Advertising Performance Reporting
For this example, I run a clickstream analysis that compares the performance of campaigns, as well as publishers within and across campaigns. SQLake enables you to:
- join impression events with campaign metadata
- report on impressions and revenue for each publisher by hour
- output tables that reflect the freshness of the continuously-streaming data
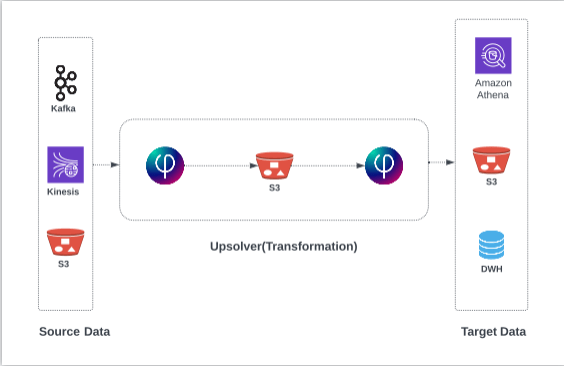
The following is the architecture I’m building to support these use cases:
Datasets
Note: For the purposes of this example, and to make it easy for you to follow along with the sample data, all of these datasets are available in the Upsolver samples S3 bucket in CSV format; log into SQLake and open the template titled Enrich adtech data with joins (sample data):
- Clicks and impressions
- Ad big events
- Advertiser information
- Campaign detail
How to Ingest and Transform Data to Produce Ad Performance Reports
Prerequisite: If you haven’t already, please sign up for SQLake. It’s free for 30 days and fully functional. No credit card required when you sign up.
Joining clicks and impressions involves 4 straightforward steps:
- Ingest and stage the source data as dimension and fact tables in your data lake
- Create materialized views for dimension tables to later join with fact tables
- Model, transform, and enrich
- Create aggregations to output the desired campaign performance results
Below I review each step, including sample code you can customize and deploy to SQLake in your own environment.
Step 1: Ingest and stage the source data in the data lake
To begin, I ingest the 4 sample data sets from Amazon S3 and stage them in the AWS data lake. (You can follow similar steps to ingest from a streaming source such as Amazon Kinesis Data Streams or Apache Kafka instead of S3.)
SQLake ingests and automatically converts the sample CSV data to Apache Parquet, which is an optimized columnar file format. SQLake also partitions the table by date and writes the results to S3. SQLake automatically creates the required metadata in the AWS Glue Data Catalog to make the staged table easily discoverable and accessible from a range of data lake query engines, such as Amazon Athena.
1a. Ingesting impression and click data
The following is sample code for creating the target staging table in the data lake. Note that, as the original data did not include a date column for partitioning, SQLake automatically injects a system column ($event_date) with a timestamp to indicate when the event was ingested. This makes it easy to partition your data, without the need to preprocess it to add a partition column.
CREATE TABLE default_glue_catalog.<DB_NAME>.adtech_impression_click()
   PARTITIONED BY $event_date;
The following code creates the staging job. This job reads the source .CSV files, infers the schema, converts the file format, and writes the output to the staging table you defined previously. Since SQLake implements schema-on-read, there is no need to enumerate the schema. SQLake detects new columns and automatically adds them to the staging table.
CREATE JOB load_impression_click_job
   CONTENT_TYPE = CSV
   AS COPY FROM S3 upsolver_s3_samples
     BUCKET = 'upsolver-samples'
     PREFIX = 'demos/blogs/adtech/impressions_click'
   INTO default_glue_catalog.<DB_NAME>.adtech_impression_click;
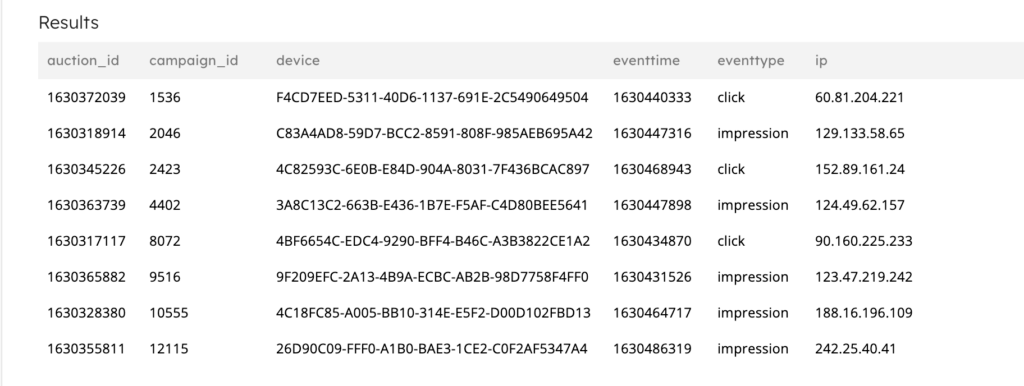
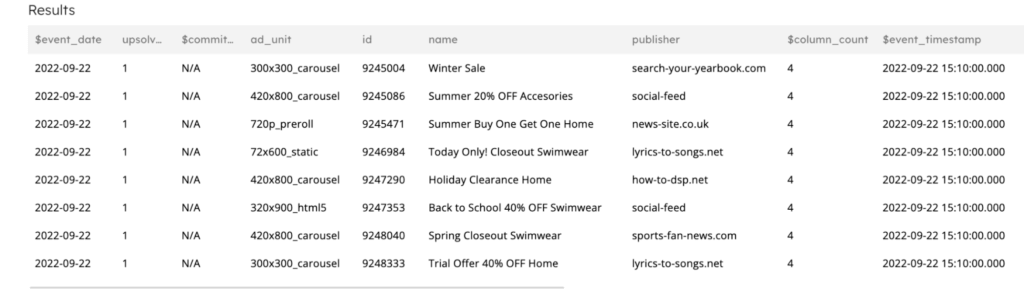
Here’s an example output when querying the staging table in SQLake:
1b. Ingesting advertiser data
Similar to the above. Create the output table, again omitting a schema because we want SQLake to automatically detect and update the schema for us.
CREATE TABLE default_glue_catalog.<DB_NAME>.adtech_advertiser()
   PARTITIONED BY $event_date;
Next, create the ingestion job that continuously reads the source files and creates the output data and metadata.
CREATE JOB load_advertiser_job
   CONTENT_TYPE = CSV
   AS COPY FROM S3 upsolver_s3_se_samples
     BUCKET = 'upsolver-samples'
     PREFIX = 'demos/blogs/adtech/advertiser'
   INTO default_glue_catalog.<DB_NAME>.adtech_advertiser;
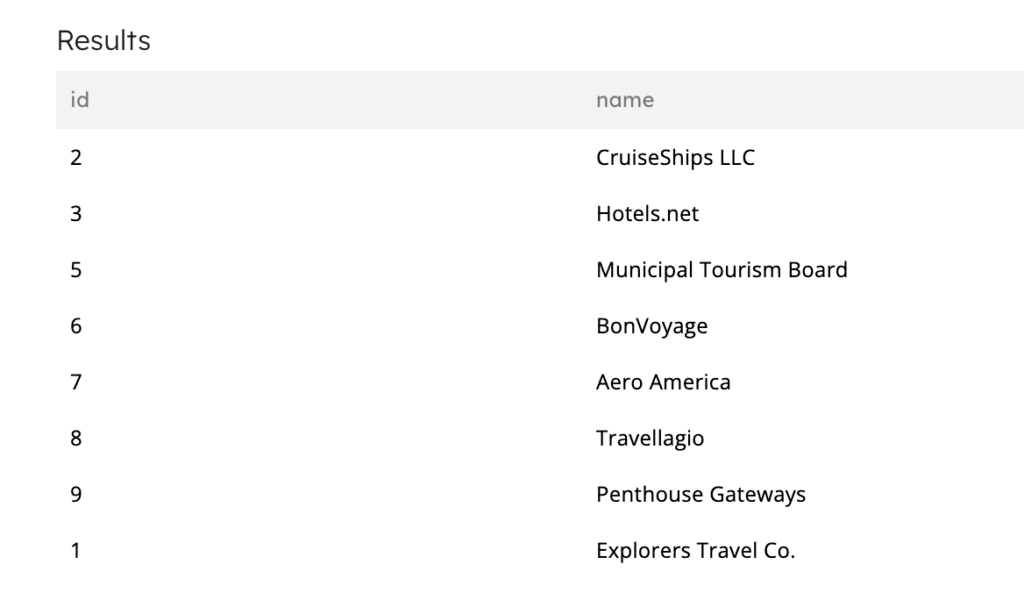
Example output of the advertisers dataset:
1c. Ingesting bid data
Now create the target table:
CREATE TABLE default_glue_catalog.<DB_NAME>.adtech_bids()
   PARTITIONED BY $event_date;
And create the ingestion job:
CREATE JOB load_bids_job
  CONTENT_TYPE = CSV
   AS COPY FROM S3 upsolver_s3_se_samples
     BUCKET = 'upsolver-samples'
     PREFIX = 'demos/blogs/adtech/bids'
   INTO default_glue_catalog.<DB_NAME>.adtech_bids;
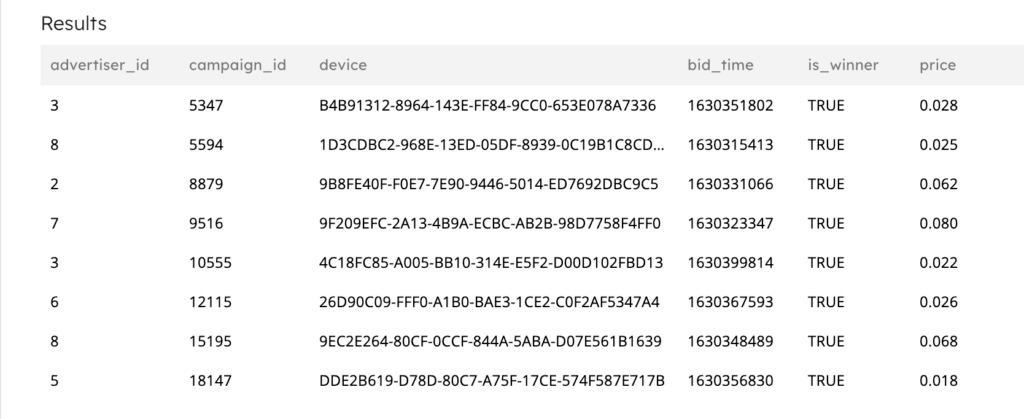
Example output of the bids dataset:
1d. Ingestion campaigns dataset
Create the target table:
CREATE TABLE default_glue_catalog.<DB_NAME>.adtech_campaign()
   PARTITIONED BY $event_date;
And create the ingestion job:
CREATE JOB load_campaign_job
  CONTENT_TYPE = CSV
   AS COPY FROM S3 upsolver_s3_se_samples
     BUCKET = 'upsolver-samples'
     PREFIX = 'demos/blogs/adtech/campaign'
   INTO default_glue_catalog.<DB_NAME>.adtech_campaign;
Example output of the campaigns dataset:
Important: When a statement is executed it is automatically activated. So when you execute the CREATE JOB statements above, they begin running immediately until you execute the DROP JOB command. The pipelines are self-orchestrating; there is no manual orchestration to set up or manage.
Step 2: Create materialized views for dimension tables
Before you can join the 3 dimension tables (advertisers, bids, and campaigns) with the fact table (impressions and clicks), you must first create materialized views of each dimension table. The materialized view returns the latest and most recently added row from each dimension table.
First, create a materialized view (MV) to return the latest row from the advertisers dimension table.
CREATE MATERIALIZED VIEW default_glue_catalog.<DB_NAME>.adtech_advertiser_lookup
AS
   SELECT
     id::string as advertiser_id,
     LAST(name::string) as advertiser_name
   FROM default_glue_catalog.<DB_NAME>.adtech_advertiser
   GROUP BY advertiser_id::string;
Next, create a MV to return the latest row from the bids dimension table.
CREATE MATERIALIZED VIEW default_glue_catalog.<DB_NAME>.adtech_bids_lookup
AS
   SELECT
     campaign_id::string as bid_campaign_id,
     LAST(advertiser_id::string) as bid_advertiser_id,
     LAST(price::string) as bid_price
   FROM default_glue_catalog.<DB_NAME>.adtech_bids
   GROUP BY campaign_id::string;
Lastly, create a MV to return the latest row from the campaigns dimension table.
CREATE MATERIALIZED VIEW default_glue_catalog.<DB_NAME>.adtech_campaign_lookup
AS
   SELECT
     id::string as campaign_campaign_id,
     LAST(name::string) as campaign_name,
     LAST(ad_unit::string) as campaign_unit,
     LAST(publisher::string) as campaign_publisher
   FROM default_glue_catalog.<DB_NAME>.adtech_campaign
   GROUP BY id::string;
As mentioned earlier, as soon as they’re executed the MVs are live and begin to accumulate data. SQLake understands that MVs depend on the previously-created staging jobs and orchestrates them so that data flows automatically from the staging table to the MV.
Step 3: Model, transform, and enrich
At this point, the raw data is staged in the data lake and you’ve created MVs to represent the dimension tables. Now it’s time to model, transform, and join the data sets to produce the final output, the one your business users will query.
Create the output table to hold the final dataset. Although you’re letting SQLake detect and update the schema automatically, you can choose to define your output schema statically, ensuring changes in the source do not affect your downstream consumers.
CREATE TABLE default_glue_catalog.<DB_NAME>.adtech_transform_sessions()
   PARTITIONED BY $event_date;
Next, create a job that selects from the fact table of impressions and clicks and joins with the dimension tables of advertisers, bids, and campaigns. Additionally you use the LET keyword to model the output by renaming columns, flattening nested fields, and creating a few computed fields. This makes it easier for your business users to understand and use the dataset. The results of this job are written into the data lake as a Parquet-backed table, where users can discover, query, and analyze it with their choice of tools.
CREATE JOB load_adtech_transform_sessions
   START_FROM = BEGINNING
   ADD_MISSING_COLUMNS = TRUE
   RUN_INTERVAL = 1 MINUTE
   AS INSERT INTO default_glue_catalog.<DB_NAME>.adtech_transform_sessions
   MAP_COLUMNS_BY_NAME
   SELECT campaign_id AS src_campaign_id,
      camp.campaign_name AS campaign_name,
      event_time as campaign_time,
      date_hour AS date_hour,
      camp.campaign_publisher AS campaign_publisher,
      device AS device_id,
      ip AS ip_address,
      camp.campaign_unit AS campaign_unit,
      bid.bid_price AS bid_price,
      bid.bid_advertiser_id AS bid_advertiser_id,
      adv.advertiser_name AS advertiser_name,
      $event_date
   FROM default_glue_catalog.<DB_NAME>.adtech_impression_click
   LEFT OUTER JOIN default_glue_catalog.<DB_NAME>.adtech_campaign_lookup as camp
     ON  campaign_id = camp.campaign_campaign_id
   LEFT OUTER JOIN default_glue_catalog.<DB_NAME>.adtech_bids_lookup as bid
     ON bid.bid_campaign_id = campaign_id
   LEFT OUTER JOIN default_glue_catalog.<DB_NAME>.adtech_advertiser_lookup adv
     ON adv.advertiser_id = bid.bid_advertiser_id
   LET
     event_time = FORMAT_DATETIME(EXTRACT_TIMESTAMP(eventtime), 'yyyy-MM-dd HH:mm:ss'),
     date_hour = DATE_TRUNC('hour', EXTRACT_TIMESTAMP(eventtime))
   WHERE eventtype = 'impression'
   AND $commit_time BETWEEN run_start_time() AND run_end_time();
Here are the results of the transformation job:
Step 4: Create aggregations to meet business needs
Your data is now ready to consume. You can keep it this way to enable users to build their own views on top using their BI tool. Or you can create additional jobs to materialize specific business views of the data that are easier to consume and report on.
A few examples of such views are:
- Sum of impressions per campaign per hour (to measure campaign effectiveness)
- Roll up by country
- Roll up by advertiser
- And so on
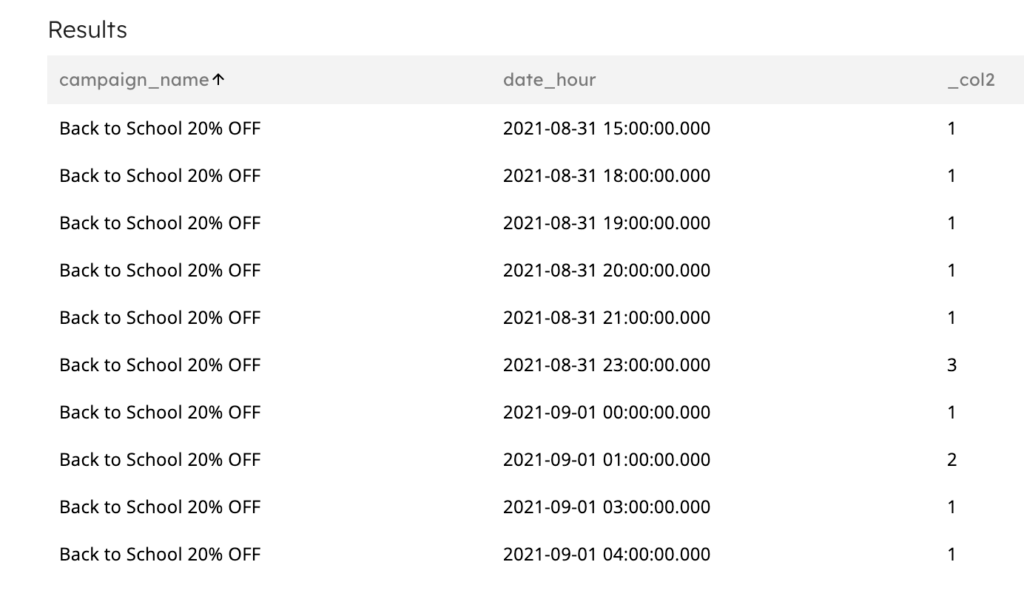
Here’s an example job to sum impressions per campaign per hour:
CREATE JOB agg_impressions_campaign_hour
   START_FROM = BEGINNING
   ADD_MISSING_COLUMNS = TRUE
   RUN_INTERVAL = 1 MINUTE
   AS INSERT INTO default_glue_catalog.<DB_NAME>.impressions_campaign_hour
   MAP_COLUMNS_BY_NAME
   SELECT
    campaign_name,
    date_hour,
    count(*) AS impression_count
  FROM default_glue_catalog.<DB_NAME>.adtech_transform_sessions
  GROUP BY campaign_name,date_hour;
Example output dataset:
Summary: From Ingest to Insight in Only a Few Minutes
Every adtech analytics and ML use case starts with the need to ingest and process large volumes of data (millions of events or hundreds of terabytes of data) per second in a scalable and cost effective manner. Lower barriers to entry and simple-to-use tools are needed to quickly extract insights and develop innovative models that improve ad performance. SQLake provides a scalable, simple-to-use, and cost-effective streaming and batch data processing platform that enables you to develop ingestion, transformation, and enrichment pipelines using only SQL. SQLake automatically performs all of the complex orchestration, data maintenance, and optimizations, and applies engineering best practices so you don’t need to.
Try SQLake for Free
Try SQLake free for 30 days today. No credit card required. Continue the discussion and ask questions in our Slack Community.
Published in:
Blog
,
Building Data Pipelines