
Explore our expert-made templates & start with the right one for you.
How to Monitor Network Device Uptime so You’re not “Driving Blind”
-
 Chandra Peddireddy
- Building Data Pipelines
- October 3, 2022
Reading and processing remote network device data typically incurs a high I/O cost when it comes to the ETL process. That’s because the data tends to consist of an extremely high volume of small events, sometimes from a large number of devices and device types – network devices (routers, switches, access points, and so on), IoT endpoints (sensors on factory equipment (IIoT), energy infrastructure, or even smartphones and fitness devices.
The Perils of Real-Time Streaming ETL
In a typical ETL process, there are discrete steps for:
- data ingestion
- cleaning
- transformation
- loading into a target system.
If it’s real time streaming data there’s even more complexity; when a job fails, you must recreate the stream, process it offline, and sync the system.
Meanwhile, device failure can result in downtime, loss of productivity, or even security risks. Hardware issues and errors can bring your entire infrastructure to a halt and cause heavy losses to your business. If you don’t track the state of your remote devices, you’re basically driving blind – headlights off on a dark road.
You can implement a complex solution using multiple technologies and systems. For example, to ingest real-time events, you can connect together Apache Kafka and Apache Spark for ingestion, store the data in Amazon S3, run a separate set of jobs to transform and maintain the data, and employ Apache Airflow to orchestrate all of these jobs. For streaming data, build in Apache Flink or Spark Streaming, too. But most of these tools in turn require their own specialized skillset, adding yet more complexity and costs, and making the project yet more difficult to accomplish for your existing team and resources.
And just managing that complexity, plus the time required to build and test all the various failure scenarios for a streaming system, may not be worth the tremendous effort required. As a result companies often decide to put off their data project, meaning they don’t get business value out of their network or IoT data. They’ll store it, but the data just sits unused in cheap lake storage because it’s too complicated to exploit.
And it’s that complexity that Upsolver SQLake aims to address.
Data Points for a Network Device Monitoring Solution
Let’s look at how Upsolver SQLake approaches this issue.
SQLake accommodates all of the complexities of sessionizing network device data in a custom function called dynamic_sessions. The dynamic_sessions function helps you reduce the amount of code and number of reads on the source data. Here’s how you can employ the Dynamic_sessions function to provide a sample solution using just SQLake – no additional tools or technologies:
Assume a hypothetical network with n devices, each of which generates an event every 5 minutes.
You must capture every event while continuously monitoring the data streams. If you don’t receive an event after 3 consecutive time intervals (15 minutes total), the system must flag the device as “down,” issue an alert, and generate a corresponding signal. Despite the intuitive description, it’s a complex problem, especially as data volume scales. At scale, it becomes increasingly difficult, time-intensive, and risky to monitor the network manually and react quickly when systems are flagged as offline.
Using SQLake to solve for network device monitoring at scale
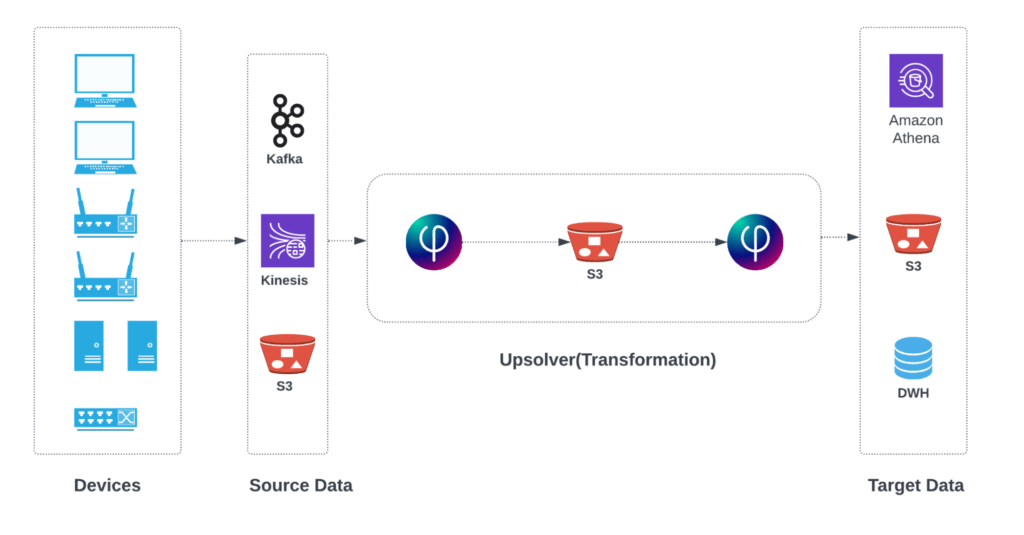
In the above architecture, device event data can come in as a set of files stored on S3 by a network device manager such as AWS IoT SiteWise or as a stream of events captured by Amazon Kinesis Data Streams or Apache Kafka. Data is then processed by SQLake in a streaming manner and the results are stored in your data lake or data warehouse.
For this use case, we assume that events are stored in S3, and that we want to write results into the data lake so it can be queried with Amazon Athena.
Using SQLake you can automatically monitor your network devices in 4 simple steps:
- Create a source table that receives events every 5 minutes
- Create a materialized view to sessionize each device
- Determine which devices were offline during a predetermined period
- Calculate total uptime per device and output to a data lake table for reporting
How to monitor your network devices
Before you begin, please be sure to sign up for SQLake for free. No credit card is required
Step 1: Create a source table that receives alerts every 5 minutes
Sample source structure:
- Device name
- Timestamp
- Attribute 1
- Attribute 2
- And so on
The following code first creates the staging table in the data. Then it creates a job that reads from the source, converts the file format, and partitions the output before loading it into the target table.code:
CREATE TABLE default_glue_catalog.<DB_NAME>.event_raw_data()
PARTITIONED BY $event_date;
CREATE JOB event_staging_job
CONTENT_TYPE = CSV
AS COPY FROM S3 Upsolver_SA_S3 BUCKET = 'upsolver-samples' PREFIX = 'demos/iot/'
INTO default_glue_catalog.<DB_NAME>.event_raw_data;
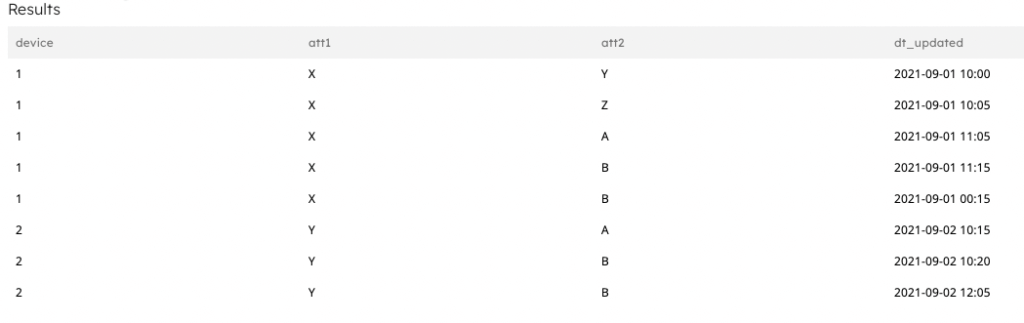
/* Inspect the raw data in the staging table */
SELECT device,att1,att2,dt_updated FROM default_glue_catalog.<DB_NAME>.event_raw_data;
Query result:
Step 2: Create a lookup table with device session data
The materialized view uses a built-in function, DYNAMIC_SESSIONS, to process all events within a given window – in this case the last 15 minutes. It then aggregates the results by the device ID (device column) and returns a single row per device.
Code example to create the materialized view:
CREATE MATERIALIZED VIEW default_glue_catalog.<DB_NAME>.event_rollup_sessions_lookup
AS
SELECT
    device as device,
    min(timestamp_cast) AS first_seen_date,
    max(timestamp_cast) AS last_seen_date,
DYNAMIC_SESSIONS(unix_timestamp/1000, (15 * 60)) AS sessions_15m
FROM default_glue_catalog.<DB_NAME>.event_raw_data
LET timestamp_cast = PARSE_DATETIME(dt_updated,'yyyy-MM-dd HH:mm'),
unix_timestamp = TO_UNIX_EPOCH_MILLIS(timestamp_cast)
GROUP BY device;
Step 3: Determine devices that did not respond in a given period of time
In this step you create a job that joins the raw event data with the materialized view containing each device’s session start and end times. The job then calculates the duration of the session representing the device uptime, the first and last time it was detected, and the most recent attributes the device published.
Note If a given device in the table displays more than 1 entry, it means the device was offline for more than 15 minutes – that is, it failed to send an event for 3 consecutive 5-minute periods.
First create an output table to store the results. Then create a job to calculate session duration and aggregate results:
CREATE TABLE default_glue_catalog.<DB_NAME>.event_logs_flatten_sessions();
CREATE JOB event_logs_flatten_sessions
START_FROM = BEGINNING
ADD_MISSING_COLUMNS = TRUE
RUN_INTERVAL = 1 MINUTE
AS INSERT INTO default_glue_catalog.<DB_NAME>.event_logs_flatten_sessions MAP_COLUMNS_BY_NAME
SELECT
r.device AS device,
FORMAT_DATETIME(from_unixtime(s.sessions_15m[].startTime), 'yyyy-MM-dd HH:mm:ss') AS s_sessions_15m_starttime,
FORMAT_DATETIME(from_unixtime(s.sessions_15m[].endTime), 'yyyy-MM-dd HH:mm:ss') AS s_sessions_15m_endtime,
(s.sessions_15m[].endTime - s.sessions_15m[].startTime) / 60 AS session_minutes,
LAST(att1) AS att1,
LAST(att2) AS att2
FROM default_glue_catalog.<DB_NAME>.event_raw_data r
LEFT JOIN default_glue_catalog.<DB_NAME>.event_rollup_sessions_lookup s ON s.device = r.device
where $commit_time between run_start_time() - PARSE_DURATION('1m') and run_end_time()
GROUP BY r.device,
FORMAT_DATETIME(from_unixtime(s.sessions_15m[].startTime), 'yyyy-MM-dd HH:mm:ss'),
FORMAT_DATETIME(from_unixtime(s.sessions_15m[].endTime), 'yyyy-MM-dd HH:mm:ss'),
(s.sessions_15m[].endTime - s.sessions_15m[].startTime) / 60;
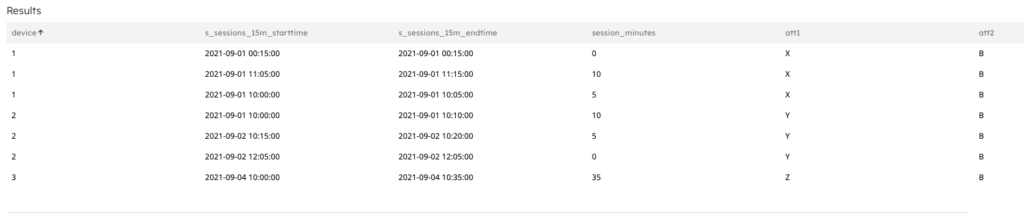
/* Query to see output */
select * from default_glue_catalog.<DB_NAME>.event_logs_flatten_sessions;
Output result:
Step 4: Determine the total uptime per device
We create another job to calculate the uptime for each device. The results return the total uptime as a percentage. If the value is 1 (which equates to 100%) it means that device is functioning and has been sending events continuously during each 15-minute window. Any other value is less than 1, indicating the device has been offline.
Create the target table, including a primary key of “device” ID. Then create the job that calculates the device uptime and updates the target table. If the row with the given device ID already exist, SQLake automatically updates the values with the recent ones. Otherwise it inserts a new row.
CREATE TABLE default_glue_catalog.<DB_NAME>.event_logs_device_uptime(
    device string)
PARTITIONED BY device
PRIMARY KEY device;

CREATE JOB event_logs_device_uptime
    START_FROM = BEGINNING
    ADD_MISSING_COLUMNS = TRUE
    RUN_INTERVAL = 1 MINUTE
AS
    MERGE INTO default_glue_catalog.<DB_NAME>.event_logs_device_uptime As target
    USING (
    SELECT
       r.device AS device,
       r.att1 AS att1,
       r.att2 AS att2,
       s.first_seen_date AS first_seen_date,
       s.last_seen_date AS last_seen_date,
       ((ARRAY_SUM(s.sessions_15m[].endTime - s.sessions_15m[].startTime)/60.0) / DATE_DIFF('minute', s.first_seen_date, s.last_seen_date)) AS uptime
FROM default_glue_catalog.<DB_NAME>.event_raw_data r
LEFT JOIN default_glue_catalog.<DB_NAME>.event_rollup_sessions_lookup s ON s.device = r.device
where $commit_time between run_start_time() and run_end_time()

    ) AS source
    ON (source.device = target.device)
    WHEN MATCHED THEN REPLACE
    WHEN NOT MATCHED THEN INSERT MAP_COLUMNS_BY_NAME;

/*     Query the output table */
select * from default_glue_catalog.<DB_NAME>.event_logs_device_uptime;
Output result:
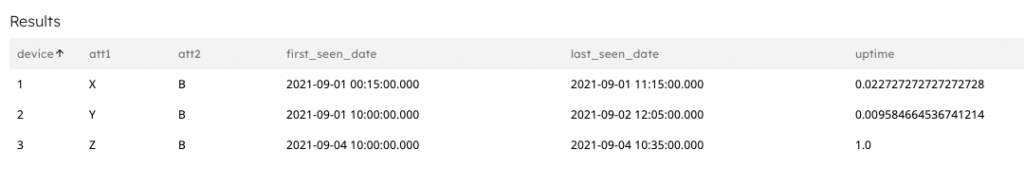
You can see from the results above that two of the devices have gone offline, prompting further investigation.
Summary: Using SQL to Track Your Network Devices
In this post, you learned how to use SQLake to ingest raw network or IoT device event data and sessionize them using a built-in DYNAMIC_SESSIONS function that enables you to calculate the uptime and availability of your network devices. With these KPIs available in your data lake, you can easily trigger alerts or include them in reports.
SQLake provides a scalable, simple-to-manage, and cost-effective streaming and batch data processing platform that enables you to develop ingestion, transformation, and enrichment jobs and pipelines using SQL. All of the complex orchestration, data maintenance, optimizations, and application of best practices are automatically performed by SQLake.
Try SQLake for free
Try SQLake today for free for 30 days. No credit card required. Continue the discussion and ask questions in our Slack Community.
Published in:
Blog
,
Building Data Pipelines