
Explore our expert-made templates & start with the right one for you.
VPC Flow Log Analytics w/ PuppyGraph and Upsolver
-
 Jason Hall
- Cloud Architecture
- April 24, 2024
Analyzing AWS VPC Flow Logs:
In today’s interconnected digital landscape, companies rely heavily on cloud computing platforms like Amazon Web Services (AWS) to host their applications and data. As the complexity of these environments grows, so does the necessity for robust security measures. AWS Virtual Private Cloud (VPC) Flow Logs provide a crucial tool for enhancing the security posture of these environments by capturing detailed information about the traffic flowing within the VPC. Analyzing these flow logs has become paramount for companies seeking to identify and mitigate security threats, optimize network performance, troubleshoot issues, and ensure compliance with regulatory standards. This proactive approach to monitoring network traffic not only helps in maintaining the integrity and reliability of the infrastructure but also empowers organizations to make informed decisions to protect their assets and reputation in an ever-evolving digital landscape.
Upsolver, the easy button for high-volume data ingestion, makes it easy to transform and load AWS VPC Flow Logs into data warehouse or lakehouse tables. This lets platform, security and application engineers query and analyze user and application traffic. These queries would typically be written in SQL and used to feed results into a report or dashboard, or possibly a search provider such as AWS OpenSearch.
Different Types of Querying:
While SQL queries are the most commonly used, Graph based analytics via graph queries are gaining popularity, due to their unique ability to quickly retrieve data relationships. Given the nature of VPC Flow Log data, which contains IP Address endpoints, and a relationship between a source and target connection, this dataset lends itself very well to graph analytics.
A primary challenge with graph analytics, is that the process typically involves running graph queries against a graph specific database platform. Modeling, and ETL’ing data into these graph databases involves not only the duplication of data into multiple formats, but also requires a costly and complex ETL process to move data between its original source, and the graph specific database.
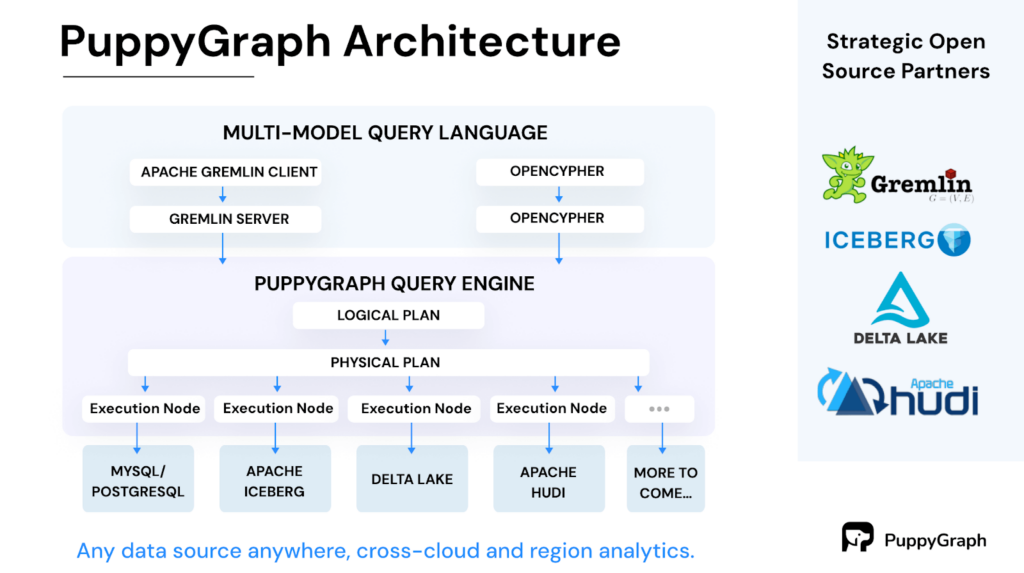
Introducing PuppyGraph:
PuppyGraph is the first graph query engine in the market that allows companies to query one or more of their existing SQL data stores as a unified graph. This means a user can query the same copy of the tabular data as graphs (via Gremlin or Cypher) and in SQL at the same time – all without the burden of ETL.
PuppyGraph sets itself apart from graph databases by decoupling storage from computation, capitalizing on the advantages of columnar data lakes to deliver significant scalability and performance gains. When conducting intricate graph queries like multi-hop neighbor searches, the need arises to join and manipulate numerous records. The columnar approach to data storage enhances read efficiency, allowing for the quick fetching of only the relevant columns needed for a query, thus avoiding the exhaustive scanning of entire rows.
With PuppyGraph, you can use the SQL data stores as you normally would, while reaping the benefits of graph-specific use cases such as complex pattern matching and efficient pathfinding. It avoids the additional complexity and resource consumption of maintaining a separate graph database and the associated ETL pipelines.
AWS VPC Flow Log Analytics at Scale:
Now that we’ve discussed why companies look to analyze VPC Flow Log data, and the different methods of querying, another challenge that companies face is how to create VPC Flow Log data sources at scale.
AWS writes Flow Log information into files, typically in Parquet format, that can be sent to S3 for storage. While each individual file is relatively small, these files are written as frequently as once per minute, and in large organizations the total volume of data within a collection of files can quickly grow into the TB per day range. This represents a data processing challenge both in the volume of data needing to be processed, and the frequency of updates to the overall data set, especially when the business requires near real-time analytics.
This is Upsolver’s specialty. By stepping through a simple no-code wizard, or generating a few lines of configuration code, Upsolver can continuously (and automatically) ingest large volumes of real time data, while automatically scaling the ingestion process and optimizing the lakehouse tables for optimal performance.
The remainder of this post will serve as a tutorial on how to leverage Upsolver and PuppyGraph together to leverage the power of graph analytics at scale within a streaming VPC Flow Log data set. This tutorial provides access to a sample data set (with sensitive data masked) that is publicly available for anyone to work with, but can also be easily modified if you’d like to connect to your own VPC Flow Log information.
Upsolver Tutorial: Ingesting and transforming VPC Flow Logs into Iceberg Tables
Step 1: Sign up for an Upsolver account
If you are new to Upsolver, the first step is to sign up for a free cloud account at https://www.upsolver.com/sqlake-signup. If you’d like to deploy Upsolver into your own AWS VPC, you can follow the simple steps outlined in the following documentation: https://docs.upsolver.com/how-to-guides/setup/deploy-upsolver-on-aws
Step 2: Create connections to your AWS data lake infrastructure
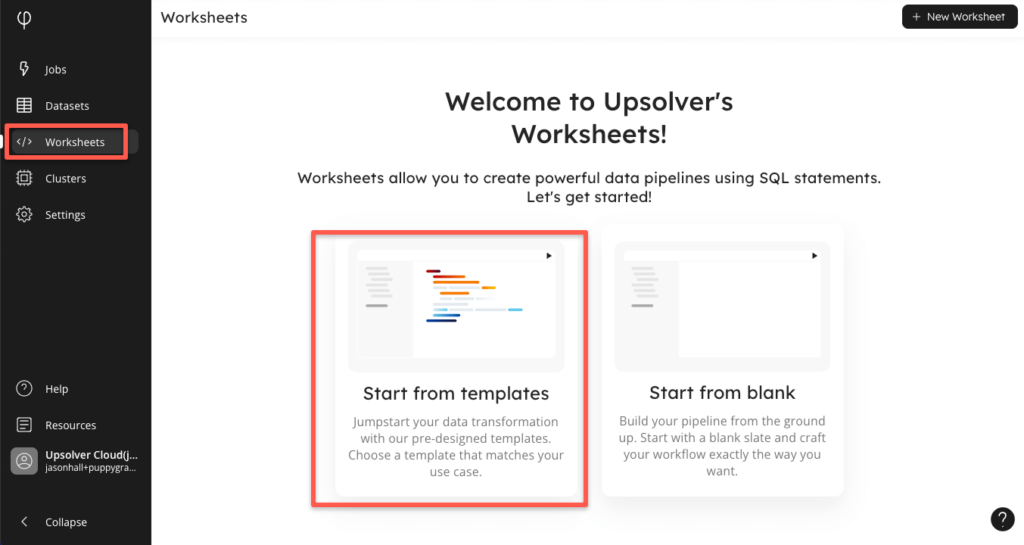
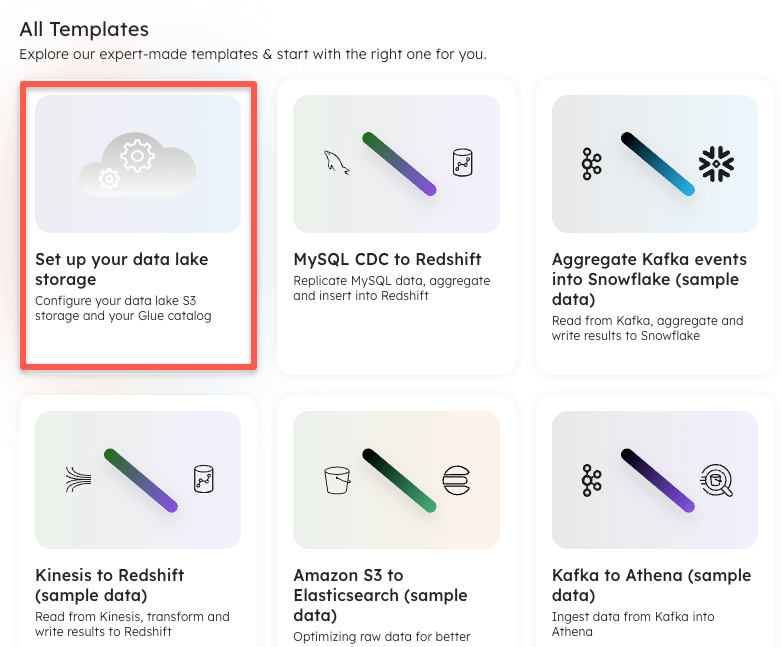
The easiest way to connect to your AWS environment when setting up a data lake infrastructure, is to navigate to the “Worksheets” section of the Upsolver UI, and find a template called “Set up your data lake storage”. It should be the first template in the gallery.
When the template opens, it provides a link to additional documentation, however the process is simply to create a connection to S3, providing an AWS role within your account that Upsolver can use for authentication and access, and a connection to your AWS Glue Catalog, providing the same role (or separate role if required) along with references to the S3 connection previously created, and the region you wish to use. Example statements for creating these connections are below:
-- 1. Create a connection to S3, your data lake storage
CREATE S3 CONNECTION default_s3_storage
AWS_ROLE = 'arn:aws:iam::<AWS_ACCT_NUMBER>:role/<AWS_ROLE_NAME>';

-- 2. Create a connection to an AWS Glue catalog
CREATE GLUE_CATALOG CONNECTION default_glue
AWS_ROLE = 'arn:aws:iam::<AWS_ACCT_NUMBER>:role/<AWS_ROLE_NAME>'
DEFAULT_STORAGE_CONNECTION = default_s3_storage
DEFAULT_STORAGE_LOCATION = 's3://<bucket>/<path>/<for>/<data>/'
REGION = '<AWS_REGION>';
Step 3: Create a connection to the S3 Bucket containing your VPC Flow Logs
You may be able to skip this step if the S3 bucket containing your flow logs is the same as the bucket that you are using for your datalake storage. If not, or you would like to connect to the Upsolver sample data, you can create an S3 connection using the following command (copy/paste into the worksheet that you have open, or create a new worksheet):
CREATE S3 CONNECTION upsolver_s3_samples
  AWS_ROLE = 'arn:aws:iam::949275490180:role/upsolver_samples_role'
  READ_ONLY = TRUE;
With your connection created, you should be able to browse the connection details in the left hand connection tree, seeing the upsolver-samples bucket, with the vpc_flow_logs folder within.
Step 4: Create a job to ingest raw VPC Flow Log data into an Iceberg table
With our connections defined, we can now set up an Upsolver job to ingest and process VPC Flow Log files into an Iceberg table. If you already have an Upsolver worksheet open, you can continue running commands within it, if not you can create a new worksheet, and enter in the following SQL:
CREATE ICEBERG TABLE default_glue.puppygraph.vpcflowlogs_connections()PARTITIONED BY $event_date;
Notice in the command above, there is no need to explicitly define a schema for this table. The schema will be automatically inferred and managed by Upsolver as it writes into this table. Upsolver will partition this Iceberg table by $event_date, which is a system column that is automatically generated and maps to the day that the event was generated.
The table created above will serve as a raw copy of all ingested flow logs. For the purpose of PuppyGraph’s analytics, rows in this table will serve as connections, since each row will have source and target IP address.
The following Upsolver job can be created to continuously load VPC Flow Log files from S3 into the Iceberg table created above:
CREATE SYNC JOB ingest_from_s3_to_vpcflowlogs_iceberg_connections_pg
  START_FROM = BEGINNING
  DATE_PATTERN = 'yyyy/MM/dd/HH/mm'
  CONTENT_TYPE = PARQUET
  COLUMN_TRANSFORMATIONS = (primary_key = UUID_GENERATOR(account_id::string))
AS COPY FROM S3 upsolver_s3_samples LOCATION = 's3://upsolver-samples/vpc_flow_logs/'
INTO default_glue.puppygraph.vpcflowlogs_connections;
Take note of the COLUMN_TRANSFORMATION configuration within this job. Puppygraph requires that tables have a primary key definition, and since there is no existing field within a VPC Flow Log record that can be used as a primary key, this configuration will generate one for each row using Upsolver’s UUID_GENERATOR function.
If using the sample S3 bucket provided above, the command can likely be run as is. If you are reading VPC Flow Logs from your own S3 bucket, you should make sure that the DATE_PATTERN matches the object format that your flow logs are stored with. If using HIVE compatible partitioning, the following DATE_PATTERN should be used:
DATE_PATTERN = '''year=''yyyy''/month=''MM''/day=''dd'Once created, the job will run continuously, reading all VPC Flow Log files that get created within the source location, processing the contents of each file, and loading rows of information into the vpcflowlogs_connections Iceberg table. While ingesting data into this table, Upsolver is also managing and optimizing the Iceberg table automatically, including running compactions, expiring snapshots, and deleting orphaned files.
Step 5: Model raw VPC Flow Log information into a unique list of devices
The table created in Step 4 will act as the “edges” within a PuppyGraph schema. These “edges” map to connections made between source and target IP addresses. Graph analytics require defined edges (which we have defined in step 4), and vertices to process relationships. For this VPC Flow Log use case, the vertices will be defined as IP addresses that serve as the sources and targets of each connection. Upsolver allows you to create a streaming transformation job that can create, and automatically update a table of vertices as raw VPC Flow Logs are ingested and processed.
First, we will create an Iceberg table to store our vertices. The statement below explicitly defines four columns:
- A device_id column that will be used as the primary key.
- A device_type column that defines whether the IP address is used as a source or target.
- A last_seen timestamp that updates based on the last time that a specific IP address was seen within the flow logs.
- A partition_date column, used to efficiently partition the table.
CREATE ICEBERG TABLE default_glue_catalog.puppygraph.vpcflowlogs_devices
(device_id string, device_type string, last_seen timestamp, partition_date date)
PARTITIONED BY partition_date
PRIMARY KEY device_id;
Once the above table is created, the following two streaming transformation jobs can be used to read data from the connections table created in step 4, and continuously update the devices table as events move through the pipeline. Two jobs are used to map devices (ip addresses) each used as sources and targets from the raw data.
CREATE SYNC JOB create_unique_device_table_from_dstaddr
  START_FROM = BEGINNING
  ADD_MISSING_COLUMNS = TRUE
  RUN_INTERVAL = 1 MINUTE
AS INSERT INTO default_glue_catalog.puppygraph.vpcflowlogs_devices MAP_COLUMNS_BY_NAME
SELECT
  dstaddr::string as device_id,
  'dest' as device_type,
  $event_date as partition_date,
  $event_time as last_seen
FROM default_glue_catalog.puppygraph.vpcflowlogs_connections
WHERE TIME_FILTER();

CREATE SYNC JOB create_unique_device_table_from_srcaddr
  START_FROM = BEGINNING
  ADD_MISSING_COLUMNS = TRUE
  RUN_INTERVAL = 1 MINUTE
AS INSERT INTO default_glue_catalog.puppygraph.vpcflowlogs_devices MAP_COLUMNS_BY_NAME
SELECT
  srcaddr::string as device_id,
  'source' as device_type,
  $event_date as partition_date,
  $event_time as last_seen
FROM default_glue_catalog.puppygraph.vpcflowlogs_connections
WHERE TIME_FILTER();
Notice that the transformation logic is modeled as a SQL Statement. The SELECT statement included in the transformation job reads data from the connections table created in step 4, maps either srcaddr or dstaddr to the device_id column (via the SELECT clause), and maps the appropriate device_type based on the job running the transformation.
Upsolver automatically maintains pipeline lineage to help engineers understand how data is moving through their pipelines. Below is a screenshot from the lineage tab of the devices table, showing a graphical architecture of the pipeline we have created:
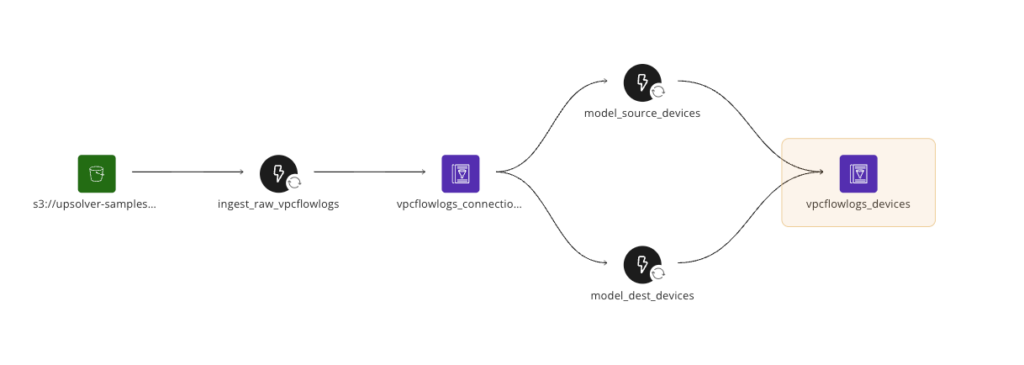
With these jobs now created, we now have a full pipeline that reads raw flow dog data from S3, parses and ingests each file into a connections table, and then models each connection into source and target devices. These jobs run continuously, updating each table in near real time. Upsolver provides extensive observability into job performance and throughput in the “Jobs” tab of the UI, and also provides very detailed data observability in the “Dataset” tab, should you want to explore the quality of data within each table.
PuppyGraph Tutorial: Running Graph Analytics on VPC Flow Logs as Iceberg Tables
Step 1: Sign up for, launch, and sign in to a PuppyGraph Instance
PuppyGraph offers a forever-free, single-noded developer edition that you can download via a quick Docker install. You can follow the getting started document for the set up process.
For the purpose of this tutorial, I have launched a PuppyGraph AWS AMI via the AWS marketplace.
For additional options, and further details, please consult the PuppyGraph documentation.
Step 2: Create a PuppyGraph schema:
PuppyGraph offers a few options for creating a schema, for the purpose of this tutorial we will manually create and upload a schema file that maps to the Iceberg tables that Upsolver is processing. The PuppyGraph schema file includes information about the table formats, catalog format, authentication, and field mappings required to run graph queries. A sample JSON schema file is included below, with sensitive data redacted. To use this file yourself, you should simply need to modify the connection and authentication details to AWS Glue and AWS S3, as shown in the blocks below:
{
  "catalogs": [
    {
    "name": "puppygraph_upsolver",
    "type": "iceberg",
    "metastore": {
      "type": "glue",
      "useInstanceProfile": "false",
      "region": "us-east-1",
      "accessKey": "<aws_access_key>",
      "secretKey": "<aws_secret_key>"
        },
    "storage": {
      "useInstanceProfile": "false",
      "region": "us-east-1",
      "accessKey": "<aws_access_key>",
      "secretKey": "<aws_secret_key>",
      "enableSsl": "false"
        }
    }
  ], …
The rest of the schema file will contain references to the Iceberg tables created in the previous steps. Make sure that the schema and table names are updated in the file to point to your specific tables.
Full schema file can be downloaded as a zip file from the below link:
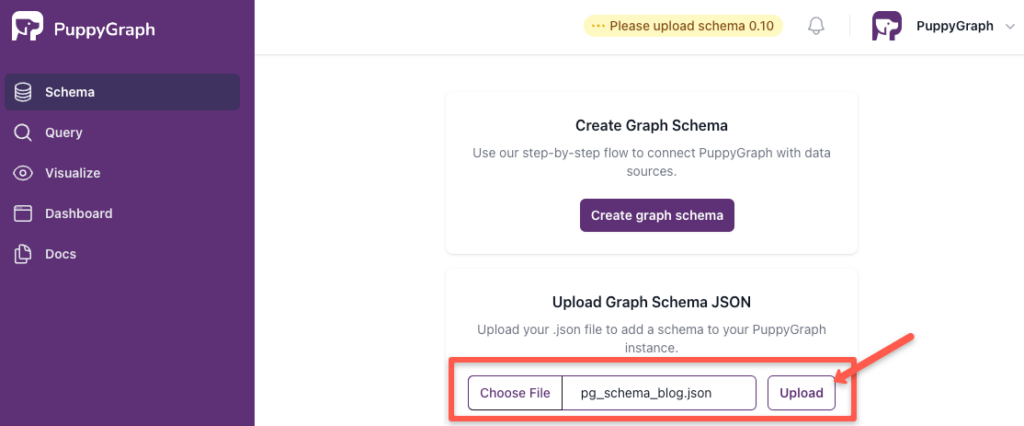
Upload your schema file into PuppyGraph, and after it is verified and processed you can begin to explore and query your data.
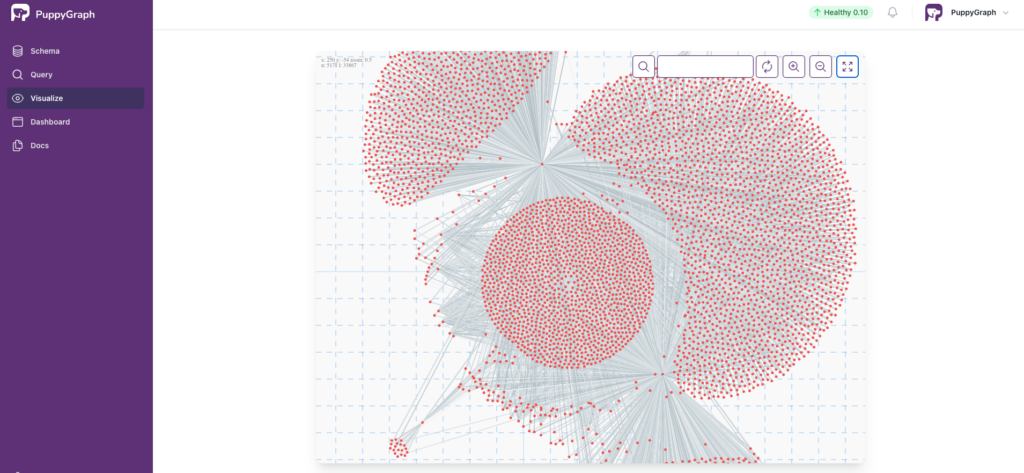
Step 3: Visualize your VPC Flow Logs
Navigate to the “Visualize” tab to see and explore your VPC Flow Logs as a graph. Devices and connections are represented in this graph, and you can zoom in, zoom out, pan around, and search through the graph to identify interesting or concerning patterns. Perhaps a cluster of connections from an unknown set of IP addresses indicates a potential breach.
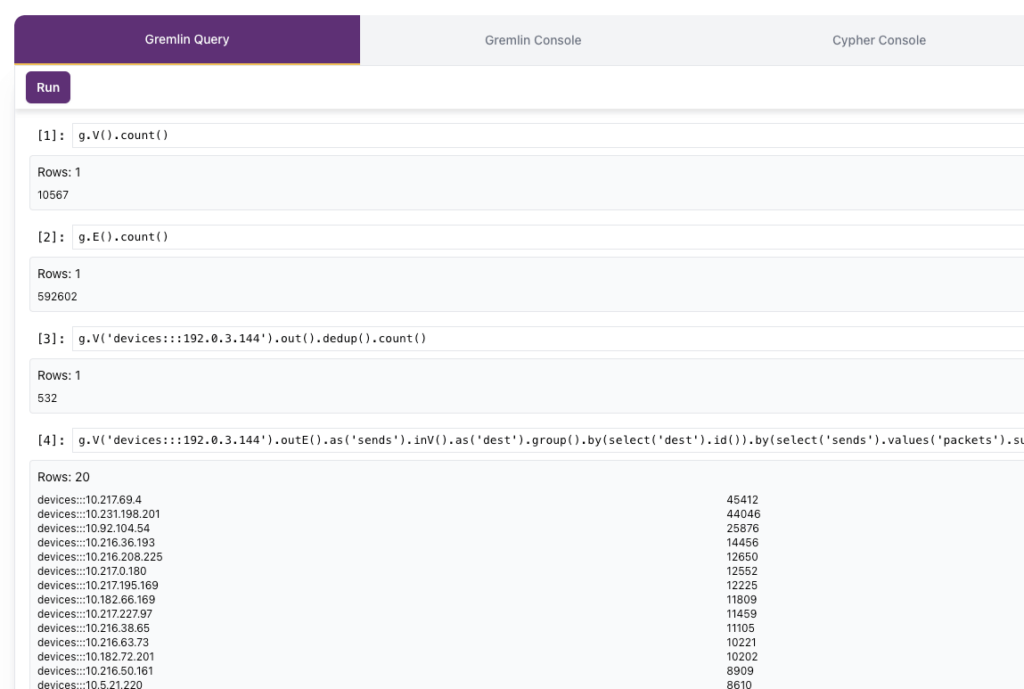
Step 4: Run graph queries against your VPC Flow Log tables
PuppyGraph includes the ability to run graph queries via Gremlin, or Cypher. Gremlin queries can be run directly via PuppyGraph from the “Gremlin Query” tab, or can be run via the command line from the “Gremlin Console” tab. Below are a few example graph queries that you can run via Gremlin, with a screenshot showing the results of the queries:
Returns the number of vertices:
g.V().count()Returns the number of edges:
g.E().count()Returns the number of unique recipients (targets) from a specific sender:
g.V('devices:::192.0.3.144').out().dedup().count()Returns the top 20 recipients, by network packets, from a given sender:
g.V('devices:::192.0.3.144').outE().as('sends').inV().as('dest').group().by(select('dest').id()).by(select('sends').values('packets').sum()).unfold().order().by(select(values), desc).limit(20)
So that’s it! Now that your VPC Flow Logs are being ingested, and transformed into Iceberg tables with Upsolver, PuppyGraph gives you the ability to query your flow logs as a graph. Feel free to continue running queries, and we’d love to hear what interesting use cases you come up with!
Try Upsolver today for free!
Published in:
Blog
,
Cloud Architecture