
Explore our expert-made templates & start with the right one for you.
The 5 Pillars of Data Observability
-
Rachel Horder
- Building Data Pipelines
- December 7, 2023
Introduction
As organizations increasingly rely on vast and complex datasets to drive decision-making processes, our ability to monitor, understand, and guarantee the quality of data becomes ever-more crucial. Data observability provides transparency into the entire data pipeline, offering insights into quality, anomalies, and performance issues. Not only does observability enhance the reliability of analytics and BI but it also facilitates the proactive identification and resolution of potential issues that could otherwise be costly. This article explores the five pillars that form the building blocks of data observability and how Upsolver can help us deliver timely and trustworthy data in each of these areas.
What is data observability?
Data observability means understanding the health and state of the data in our organization. By proactively using observability tools, you can detect, troubleshoot, and resolve issues within your data, ideally before they reach downstream destinations, such as your data warehouse.
In essence, data observability provides us with the necessary insights to understand the behavior of our data infrastructure, detect anomalies, and maintain expected data quality standards. By embracing data observability, we can enhance the reliability of our data pipelines, efficiently troubleshoot problems, and ultimately create robust and resilient data products.
Why do I need data observability?
Not only are we producing more data than ever before, through IoT devices, sensors, social media, and so on, but there are also more of us consuming this data. Today, data is both big and fast flowing, and, to make reliable business decisions, we need accurate, fresh, high-quality data that we can trust: data observability can help us achieve these aims.
The five pillars of data observability are:
- Freshness: how up to date are the files and tables? Did the dataset arrive on time?
- Volume: has the number of ingested events unexpectedly increased or decreased?
- Schema: is the data organized in the format we expect?
- Quality & Distribution: are the attributes of the data within their expected ranges?
- Lineage: do we have the ability to trace the provenance and impact of each field and data point?
How Do I Observe My Data?
When users are asking questions such as, “Why hasn’t my dashboard been updated?” or “Why do we have so many NULLs?”, we need to know where data comes from, when it comes in, and where it lands, so we can understand where and why we have issues. Data observability is built into Upsolver as standard, saving you the time and cost of having to query your data warehouse or acquire additional resources to build custom reports. Using Upsolver, you can quickly and easily monitor the freshness and quality of your data at scale and in real time. Anyone who has access to your organization can observe data without needing to write code or perform complex configuration.
Let’s take a closer look at how Upsolver’s inbuilt observability tools will help you gain instant insight into your data.
1 – Freshness: Checking Data Latency
Your business requirements will determine the acceptable latency of your data. For example, a banking app must have real-time data to detect suspicious activity or check credit limits. If data is up-to-date, the right actions can be taken, such as capturing fraudulent transactions or authorizing a payment – but if data is late, the impact can be far-reaching and costly, and we need to uncover the problem within the expected SLA. Other businesses or departments may only need their data up to the last hour, or day, so this isn’t a one size fits all approach.
Upsolver shows us when the data in our source staging dataset was last refreshed, and we can dig deeper by using the first and last seen timestamps to check that columns within the dataset continue to refresh:
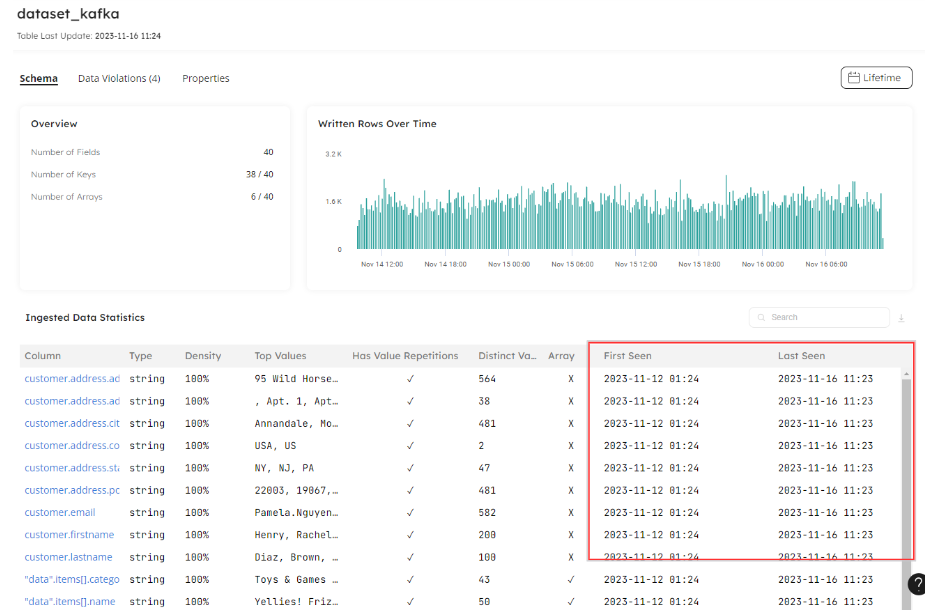
We can observe the freshness of data in both our staging and target tables, ensuring that data is flowing in a timely manner that meets the expectations of the consumer. While in-house teams may endure a lag in data without serious consequence, any data consumed by customers, if it becomes stale, could have a negative impact on our reputation and sales. In addition to alerting us and helping us resolve any issues quickly, observability into data delay also lets us prepare our data consumers accordingly. A delay itself may be more palatable if it’s announced in advance. Just like software, data can have downtime, but downtime should never come as a surprise. Upsolver enables us to monitor our data to ensure we meet or update expected SLAs on data arrival and delivery.
2 – Volume: Monitor Data Flow in Your Pipelines
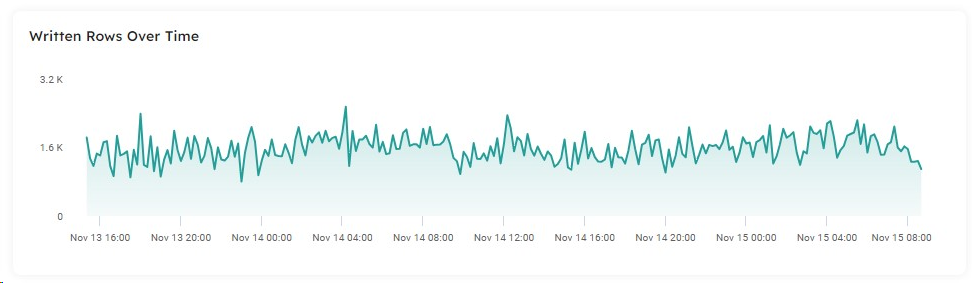
Upsolver pipelines automatically scale to handle unpredictable data flows and we can view the volume of written rows to gain a feel for the average number of events to expect in our stream:
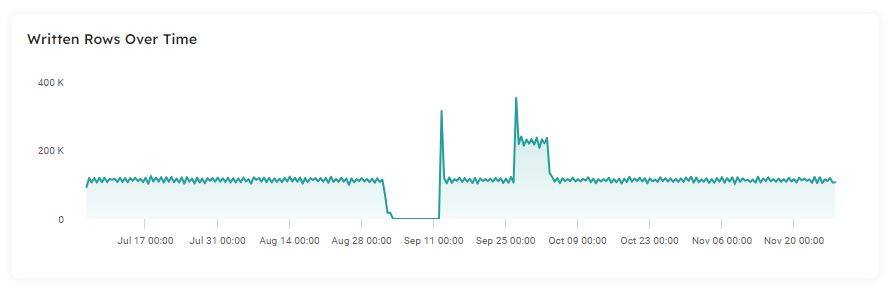
Upsolver enables us to proactively monitor event volume and rate. When we discover the data size looks incorrect, we can troubleshoot the problem to determine if the pipeline is broken, the source system’s data production rate has increased unannounced, or there has been an outage in the source system or infrastructure:
3 – Schema: Detecting Evolution
When we ingest data from external sources, we generally don’t have control over the schema. Schema drift can even be a problem with in-house applications when developers add, alter, or drop columns, unaware of the downstream consequences in the data warehouse and analytics solutions that depend on them.
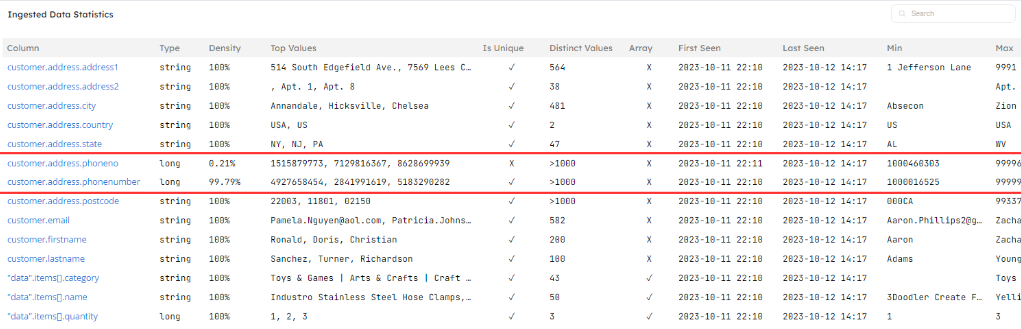
Upsolver infers the source schema and automatically handles changing column names and types to prevent your pipelines from breaking. You can easily observe evolving schemas by looking at the ingested data statistics to uncover changes along with the exact time of the change. An example can be seen here, where the creation of an additional column to store the customer’s phone number, forces the phone number information to be split into two columns:
Such a scenario would cause obvious breakages in reports that query the original column, as some portion of the time data isn’t written to it. The report consumer may not be authorized to access the data warehouse to troubleshoot this problem and would therefore be unaware that data is now arriving in a new column. All they would see is the first column failing to update, perhaps through a series of inscrutable NULL values.
Having uncovered this issue with built-in observability in Upsolver, we can amend our pipeline to merge the columns into one and direct the data to the corresponding target column. Upsolver provides column transformation features we can build into our ingestion pipelines to deal with data in flight and resolve problems before they reach the data warehouse.
4 – Quality & Distribution: Observing Data Veracity
If you’re familiar with the five Vs of big data, then you’ll know that veracity refers to the quality and trustworthiness of our data. But while we can throw academic terminology at the problem, what this really means to end-users is that the data is “wrong” and it’s simply not good enough to report on. Data might be missing, out of range, or in the wrong place, with consumers asking “Why do I have values that are too high or too low?”, or “Why do we have negative numbers?”
In a traditional ETL pipeline whereby data is extracted from a highly-structured relational database and transformed in a staging table, anomalies can be detected and data verified prior to the load, ensuring dimensions remain intact.
Streaming and unstructured data breaks the rigid rules of classic transformation processes, delivering data faster but leaving us with unpredictable formats, types, and schemas.
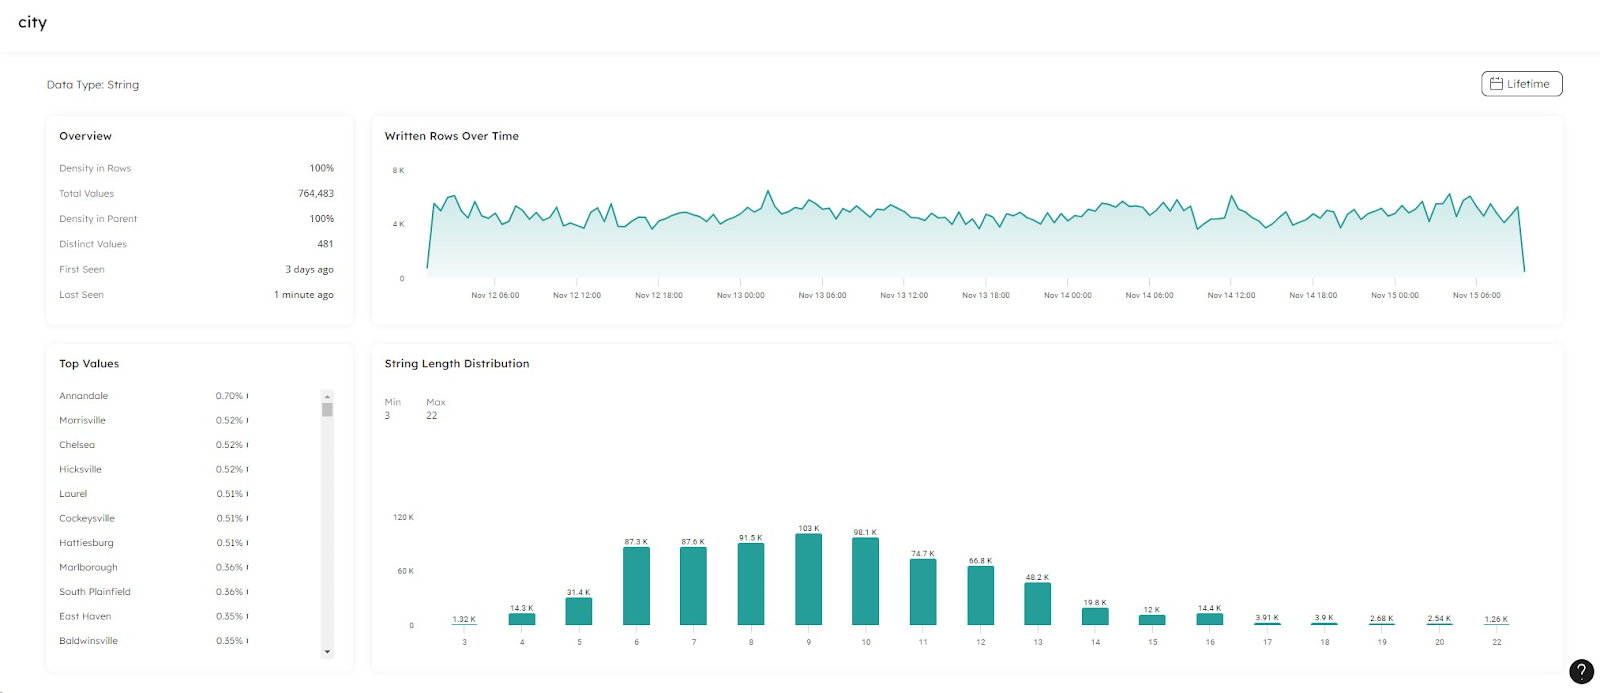
Upsolver enables us to drill into each column in our dataset, presenting the distributions of both numerical fields and character-lengths of string or categorical ones. For all fields, the minimum and maximum values are reported up-to-date. This enables us to uncover problematic data that would otherwise break data warehouse dimensions. If we are expecting the length of characters in our US state column to be two, for instance, then we can use the distributed string length chart to immediately identify any problems:
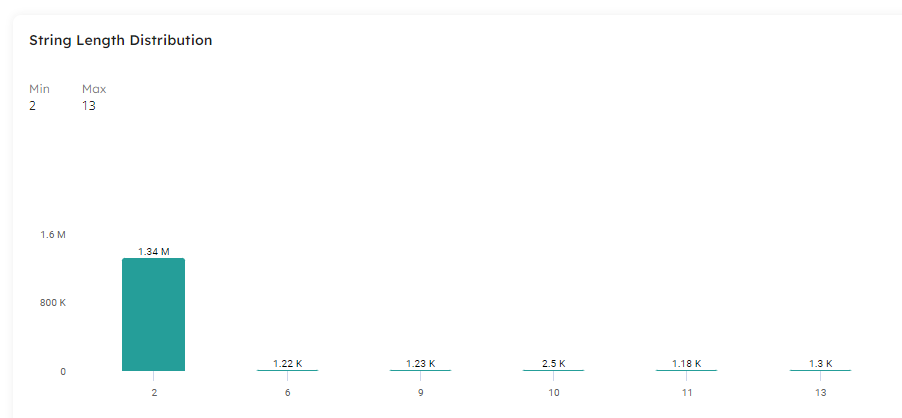
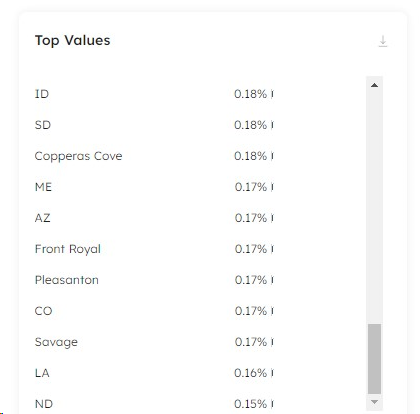
We can see from our min and max string lengths that the data contains incorrect values and dig into the column data to uncover the anomalies. It is immediately evident that data has landed in the incorrect column for some records:
Assuming we have no control over the source system to define restrictions that prevent this occurring, our alternative option is to handle this data in-flight at ingestion. Thankfully, Upsolver provides the ability to do just that in the form of expectations. We can define a rule whereby any row with a state length value over two characters will raise an alert or be dropped from the pipeline:
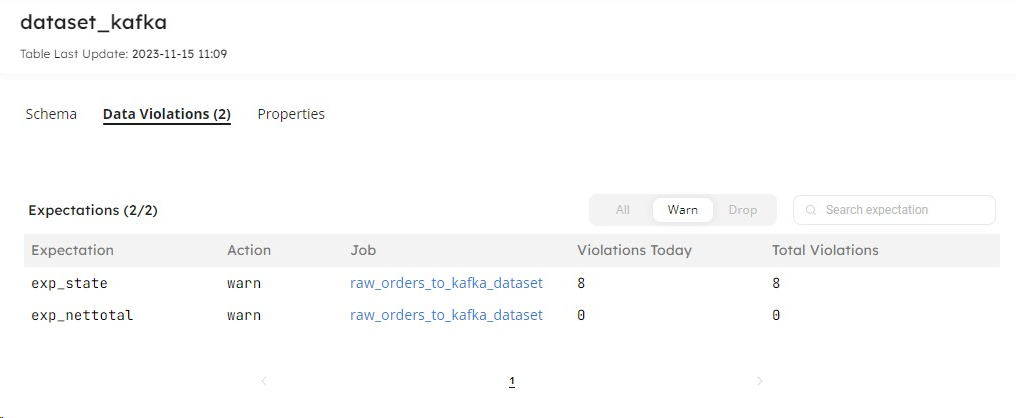
Having created an expectation on our state column we can continue to observe the number of rows violating our data quality rule. Column-level expectations in Upsolver can be any allowable assertion in SQL on a single column.
5 – Lineage: Tracking Data from Start to Finish
More often than not, we don’t know we have a problem with our data until it lands in its destination and a user notifies us that their dashboard is showing spurious results. This is when we need to trace our data back through the pipeline, possibly as far as its original starting point to uncover transformations or problems that arose along the way to create the issue.
Using Upsolver, we can open the dataset that is at rest in the target – such as a table in Snowflake – and verify the issue the user has raised:
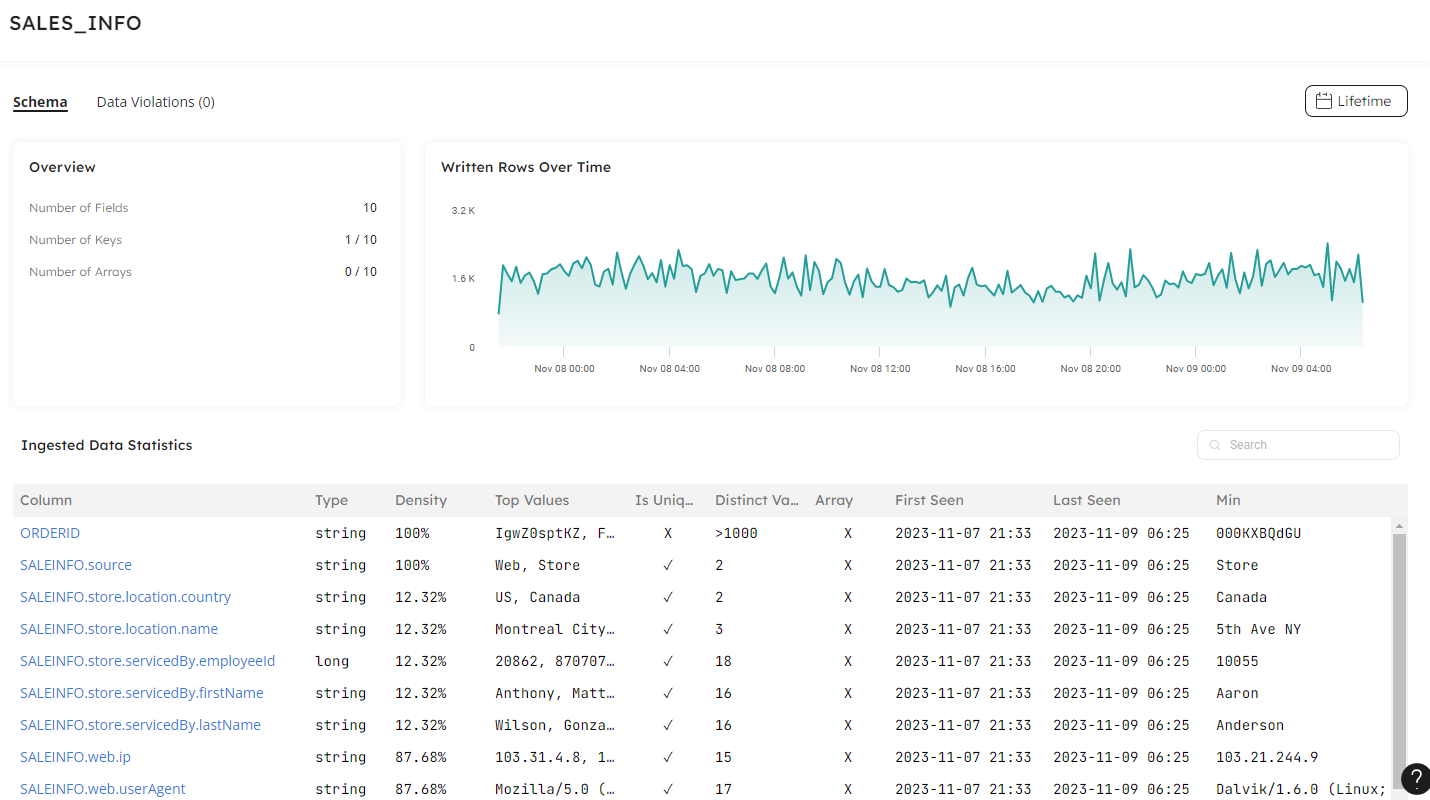
The column timestamps confirm whether this is a freshness issue and we can drill through to profile the column and ask the following questions to troubleshoot the problem:
- Type: is the column data stored in the correct type for the values?
- Total Values: how many rows should be in this column? Is this a set number, or can we work from an approximation?
- Distinct Values: as above, how many values do we expect in this column? For US states, this should not be above 50, but if this was the customer email address column, should this match the Total Values amount so we have one email address per customer?
- Density in Rows: is this a required field in the source system, so that we can expect 100% density? If this is less, where has the data gone missing?
- First Seen: when did this column first appear in our dataset? Is this a new column that has recently arrived?
- Last Seen: when was this column last seen in our dataset? Does it continue to be updated or was it removed from the source?
- Written Rows Over Time: is the correct volume of data flowing into this column? If the number of events appears low or has dipped, is there missing data?
- Values by Frequency: how are the data values distributed across the column? Does one value appear too many times, or not enough?
- Value Distribution: Are the values within the expected range, or do the min and max values show an issue in this column?
The same column statistics are available for datasets stored in our data lake and we can trace back to the previous state of the data. This is known as time travel and is extremely useful for debugging data quality issues. Further to checking the datasets, we can view the job which ingested or loaded the data to check for any transformations that were applied or for any columns that were deliberately excluded from the pipeline.
Upsolver helps us trace our data back from our downstream target all the way to its first ingested state, enabling us to view the steps and any modifications that might affect the data while in-flight.
Summary
Upsolver includes built-in observability tools so you don’t need to write any extra code or build custom reports to monitor the data in your pipelines. The Datasets feature within Upsolver enables you to monitor your data for freshness – both in your data lake tables and in your targets, such as Amazon Redshift and Snowflake. The visuals deliver instant understanding of the flow of written rows, allowing you to gauge average stream flow rate and detect sudden spikes or dips in volume. Upsolver’s ingestion engine handles schema changes automatically, preventing pipeline breakages, and you can inspect column and type changes to discover alterations and when they happened.
Furthermore, column-level statistics help you discover and handle bad-quality data and troubleshoot related issues surfacing in your dashboards or other downstream usage. Combined with Upsolver’s powerful expectations feature, you can set quality standards to tag or drop poor data in-flight before it lands in your data warehouse, and easily monitor the number of rows violating the rules. You can also view statistics in your staging and target tables to trace issues both up and down your stream to uncover lineage information.
To experience the power of data observability in Upsolver, follow the step-by-step instructions in our How to Observe Data with Datasets guide and learn how to build a pipeline, observe your data, and create an expectation to manage in-flight data quality issues.
Try Upsolver for Free
Want to try Upsolver for yourself and see how it works? It’s easy and free – and you’ve got two options:
- Recommended: Schedule a walkthrough call with a solution architect. We’ll help set up Upsolver in your environment and teach you some valuable best practices to help you get the most out of your trail.
- You can create a free SaaS account here (no infrastructure setup) and start self-evaluating immediately.
Published in:
Blog
,
Building Data Pipelines